¶ Dashboard
The RevCent dashboard is an extremely powerful reporting solution within your RevCent account. The dashboard allows you to see broad and granular insights into your business. The aggregations, elements and filtering available in the dashboard enable to you create the exact report you want.
¶ Overview
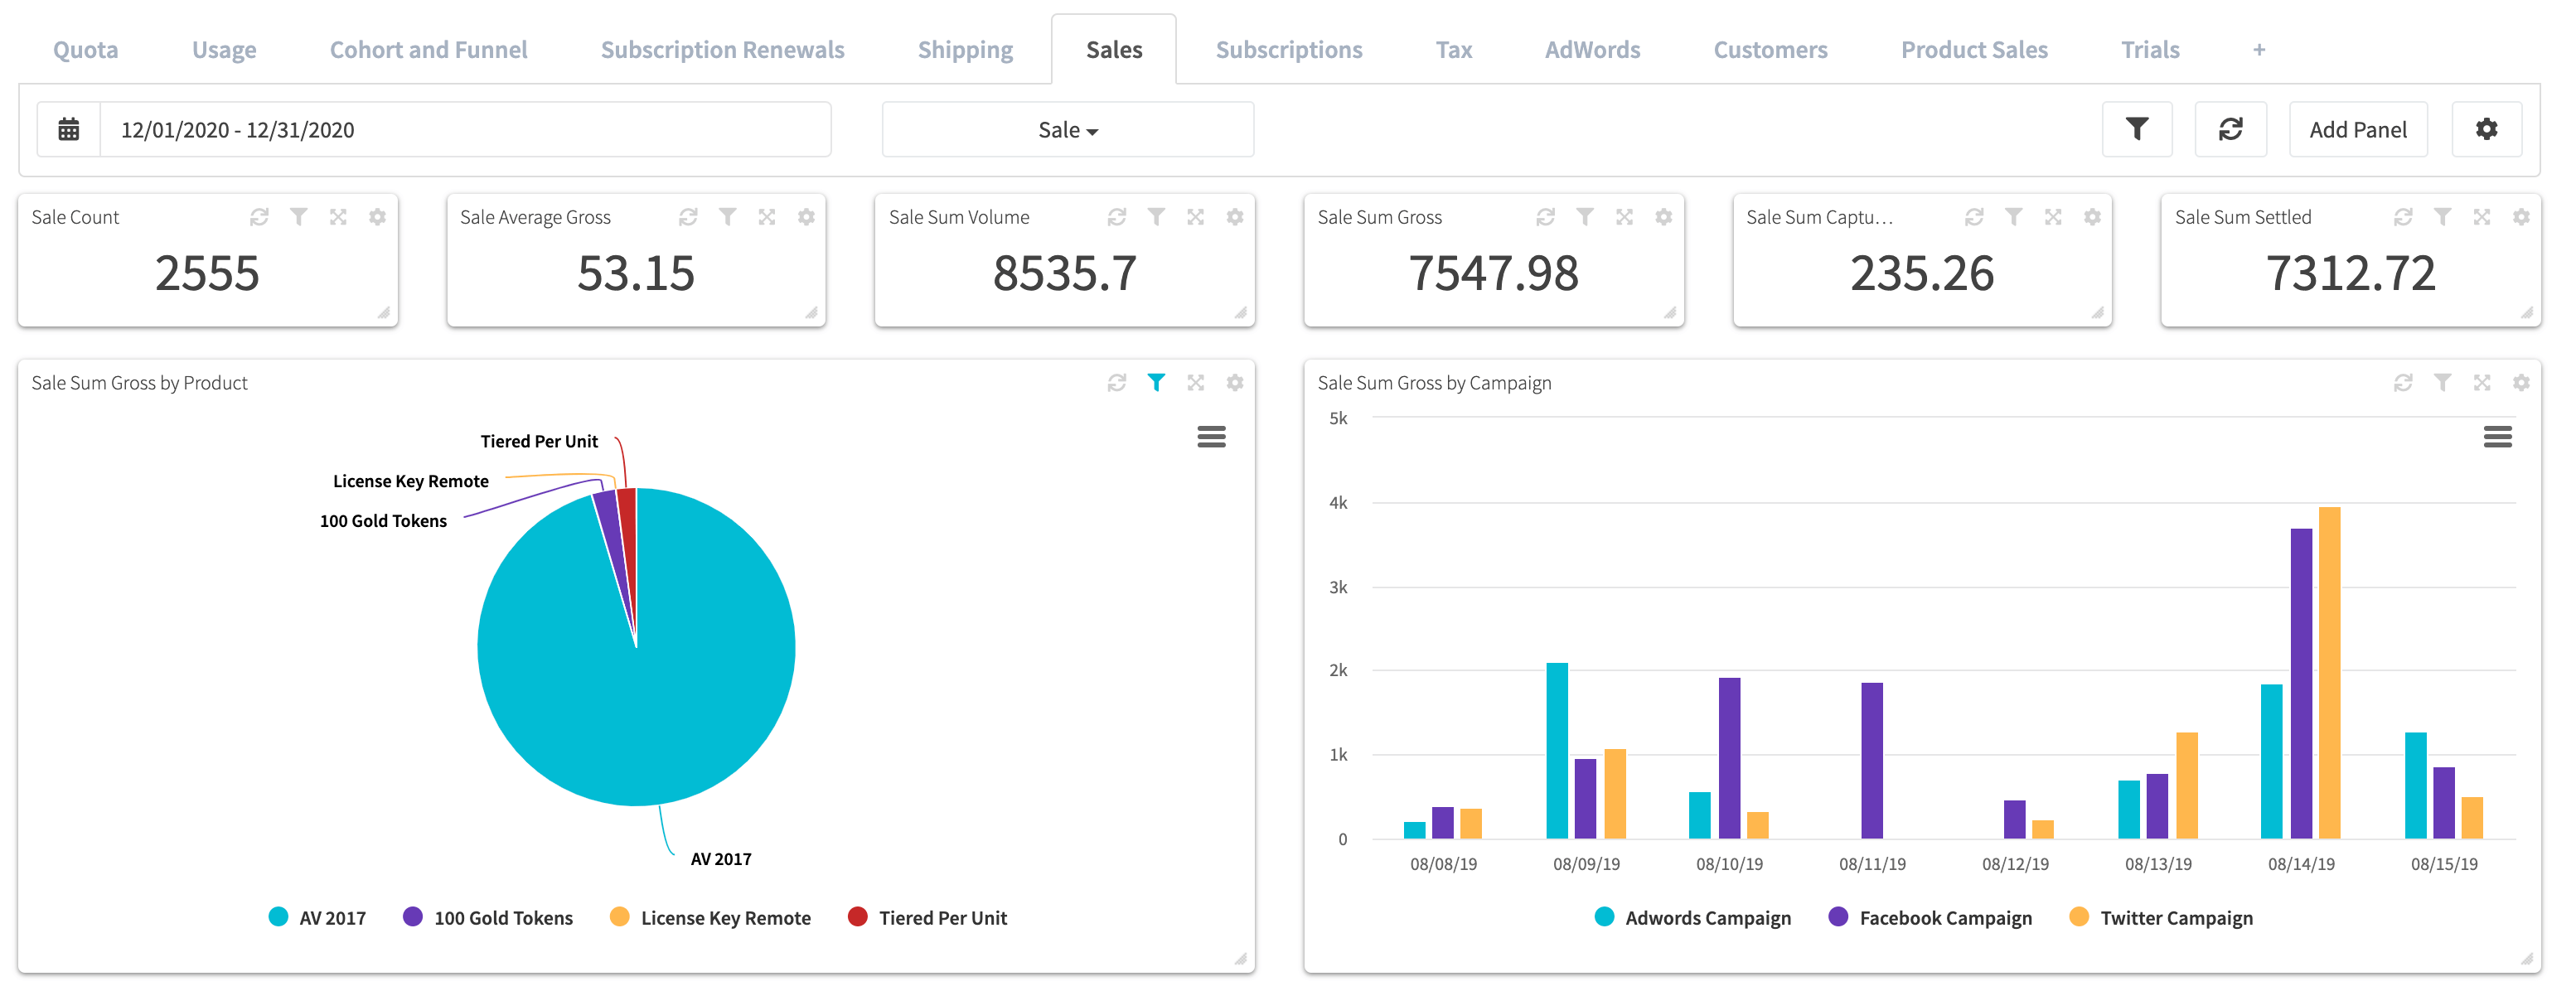
The dashboard can be customized exactly how you want. Organize using tabs and create panels within each tab to view metrics, charts, maps and more. Create as many tabs as you want.
¶ Tab
Tabs are simply the organization of panels within your dashboard. Think of a tab as a folder that exists to contain clutter and improve performance.
¶ Overview
Tabs give you the ability to segment and group panels. Without tabs, your dashboard would become disorganized and cluttered. The customizable nature of the dashboard allows you to segment aggregations using tabs, and view the segmented data within each tabs' panels.
¶ Create A Tab
1. Go to your RevCent Dashboard
2. Click the Add Tab button.

3. A pop up will appear giving you three options.
- Add Blank Tab: Create a completely blank tab and make your own panels.
- Import Tab: Select a previously downloaded tab JSON file from your computer.
- Select Pre-Built Tab: Select a pre-built tab created by RevCent in the dropdown. Click the green cloud button to load.
¶ Exporting Tab JSON
1. Go to your RevCent Dashboard, and activate the tab you wish to export by clicking the tab name.
2. Click the tab settings button on the right side of the tab toolbar.

3. In the dropdown select Export.
4. Save the file to your local computer.
¶ Importing Tab JSON
1. Go to your RevCent Dashboard
2. Click the Add Tab button.

3. A pop up will appear giving you three options.
4. Click the Import Tab button and select a previously downloaded tab JSON file from your computer.
5. A new tab containing the imported panels should appear.
¶ Panel
The panel is an individual aggregation displayed using an element. Each panel is its own unique aggregation, with the ability to filter independently. View Panel Examples.
¶ Overview
The panel consists of the panel type, aggregation and element display. The panel settings, including analytic, grouping, element options, date range and filters determine the aggregation output and its display.
The diagram below shows how a panel is constructed. The type, filters, analytic and element settings determine the panel element displayed.

¶ Panel Type
The panel type determines that actual source data being aggregated with a given date range. For example, if you select a panel type of Sale, then sales within your account will be aggregated.
¶ Types
- Customer: Customer aggregations, specifically lifetime values for customers created within a given date range.
- Product Sale: Product sale aggregations, which includes shipping and tax specific to each product sold within a given date range.
- Quota Account: Quota account aggregations within a given date range.
- Quota Account Ledger Entry: Quota account ledger entry aggregations within a given date range.
- Revenue: A combined aggregation for sales, subscription renewals and trials which expired within a given date range.
- Sale: A combined aggregation for product sales, shipping and tax for initial sales created within a given date range.
- Salvage Transaction: Salvage transaction aggregations within a given date range.
- Shipping: Shipping aggregations within a given date range.
- Subscription: Subscription aggregations, including future volume, total volume and past amounts within a given date range.
- Subscription Renewal: Subscription renewal aggregations within a given date range.
- Tax: Tax aggregations within a given date range.
- Transaction: Credit card transaction aggregations within a given date range.
- Trial: Trial aggregations for trials which have been created or expired within a given date range.
- AdWords Campaign: AdWords campaign aggregations within a given date range.
- AdWords Ad Group: AdWords Ad Group aggregations within a given date range.
- AdWords Ad: AdWords Ad aggregations within a given date range.
- AdWords Keyword: AdWords Keyword aggregations within a given date range.
¶ Analytic
The panel analytic composed of the analytic aggregation and the analytic value. The analytic aggregation determines the aggregate math being applied to the analytic value. The analytic value determines the panel types' source value being aggregated. Depending on the panel type, certain analytic values are not available.
¶ Analytic Aggregations
| Option | Description | Example |
|---|---|---|
| Sum | The sum of the analytic value aggregated. | If Panel Type = Sale and Analytic Value = Gross, the aggregation will be the sum amount gross for sales. |
| Average | The average of the analytic value aggregated. | If Panel Type = Sale and Analytic Value = Gross, the aggregation will be the average amount gross for sales. |
| Count | The count of the item specific to the panel type. | If Panel Type = Sale, the aggregation will be the total number of sales. Note: Analytic Value is ignored as you are simply counting the number of items. |
¶ Analytic Values
There are several analytic values, each having its purpose, ultimately allowing fine grained metrics. It is important to understand what each value is, and/or how it is calculated. Please refer to the table below.
| Value | Description | Alias | Calculation |
|---|---|---|---|
| Volume | The total calculated amount when an item is first created. I.e. the sum of all products, tax and shipping without discounts applied. | amount_original_total | |
| Discounted | The amount of any discounts applied in the initial sale. | amount_discounted | |
| Refunded | The current amount of any refunds, including cancelled trial amounts. | amount_refunded | |
| Total | The current total amount after any refunds and discounts applied. | amount_total | amount_original_total - (amount_refunded + amount_discounted) |
| Gross | The current gross amount, money actually transacted. I.e. payments processed minus any payments refunded. | amount_gross | payments - payments_refunded |
| Fees | The current amount of calculated fees deducted by a payment processor. | amount_fees | amount_gross * processor_fee_percentage |
| Net | The current net amount. | amount_net | amount_gross - amount_fees |
| To Salvage | The current amount of any salvage transactions not yet salvaged. | amount_to_salvage | |
| Remaining | The current amount remaining to be processed. I.e. trials not yet expired or salvage transactions not yet salvaged. | amount_remaining | amount_to_salvage + awaiting_trial_expirations |
| Price | The price of the product. | product_price | |
| Quantity of Goods | The total quantity of goods. | amount_quantity_of_goods | |
| Cost of Goods | The total cost of goods. | amount_cost_of_goods | |
| Cost of Shipping | The total cost of shipping. | amount_cost_of_shipping | |
| Tax | The total tax amount. | amount_tax | |
| Profit | The total calculated profit. | amount_profit | amount_net - (amount_cost_of_goods + amount_cost_of_shipping + amount_tax) |
| Future Volume | The forecasted future volume for subscriptions based on active status, amount and frequency. Subscription panel only. | subscription_future_volume | |
| Past & Future Volume | The future volume and past volume. Subscription panel only. | subscription_renewal_amount_total + subscription_future_volume | |
| AdWords Ad CPC | The cost per click for items associated with an AdWords click. Requires linked AdWords account. | ||
| AdWords Ad Clicks | The total number of clicks for items associated with an AdWords click. Requires linked AdWords account. |
¶ Analytic Values (Customer Panel)
The Customer panel has several unique values, specific to customer aggregations. Refer to the table below for Customer analytic values. The Type column indicates the method RevCent used when calculating the value for each customer, not to be confused with the Analytic Aggregation Options.
| Value | Type | Description |
|---|---|---|
| Gross | sum | The total lifetime gross across all sales and all renewals. |
| Refunded | sum | The total lifetime amount refunded. |
| Has A Sale | boolean | A value of 1 or 0, i.e. true or false. If customer has one or more sales on record, regardless of status, then value is 1 (true), else value is 0 (false). |
| Has A Sale Perc | perc | The percentage of all customers that have a sale, regardless of sale status. |
| Has A Success Sale | boolean | A value of 1 or 0, i.e. true or false. If customer has one or more sales on record with amount_gross > 0, no chargeback and no fraud detection, with or without refunds or amounts remaining, then value is 1 (true), else value is 0 (false). |
| Has A Success Sale Perc | perc | The percentage of all customers that have a successful sale. |
| Has A Full Success Sale | boolean | A value of 1 or 0, i.e. true or false. If customer has one or more sales on record with amount_gross > 0, no chargeback and no fraud detection, without refunds or amounts remaining, then value is 1 (true), else value is 0 (false). |
| Has A Partial Success Sale | boolean | A value of 1 or 0, i.e. true or false. If customer has one or more sales on record with amount_gross > 0, no chargeback and no fraud detection, with refunds or amounts remaining, then value is 1 (true), else value is 0 (false). |
| Has No Sale | boolean | A value of 1 or 0, i.e. true or false. If customer does not have a sale on record, i.e. newsletter signup, then value is 1 (true), else value is 0 (false). |
| Has No Sale Perc | perc | The percentage of all customers that do not have a sale, i.e. newsletter signups. |
| Sale Gross | sum | The total lifetime gross of initial sales, .i.e. sum_amount_gross across all sales. |
| Sale Num | count | The total lifetime number of initial sales regardless of status. |
| Sale Success Gross | sum | The total lifetime gross of initial sales which were successful, with amount_gross > 0, no chargeback and no fraud detection, with or without refunds or amounts remaining, then value is 1 (true), else value is 0 (false). |
| Sale Success Num | count | The total lifetime number of initial sales which were successful, with amount_gross > 0, no chargeback and no fraud detection, with or without refunds or amounts remaining, then value is 1 (true), else value is 0 (false). |
| Sale Success Perc | perc | The percentage of successful sales compared to all sales. |
| Sale Full Success Gross | sum | The total lifetime gross of initial sales which were fully successful, with amount_gross > 0, no chargeback and no fraud detection, without refunds or amounts remaining, then value is 1 (true), else value is 0 (false). |
| Sale Full Success Num | count | The total lifetime number of initial sales which were fully successful, with amount_gross > 0, no chargeback and no fraud detection, without refunds or amounts remaining, then value is 1 (true), else value is 0 (false). |
| Sale Partial Success Gross | sum | The total lifetime gross of initial sales which were partially successful, with amount_gross > 0, no chargeback and no fraud detection, with refunds or amounts remaining, then value is 1 (true), else value is 0 (false). |
| Sale Partial Success Num | count | The total lifetime number of initial sales which were partially successful, with amount_gross > 0, no chargeback and no fraud detection, with refunds or amounts remaining, then value is 1 (true), else value is 0 (false). |
| Sale with Fraud Alert Amount | sum | The total lifetime amount of sales marked with a fraud alert. |
| Sale with Fraud Alert Num | count | The total lifetime number of sales marked with a fraud alert. |
| Sale with Fraud Alert Perc | perc | The percentage of sales with a fraud alert compared to all sales. |
| Sale with Fraud Detection Amount | sum | The total lifetime amount of sales with a confirmed fraud detection. |
| Sale with Fraud Detection Num | count | The total lifetime number of sales with a confirmed fraud detection. |
| Has Upsell | boolean | A value of 1 or 0, i.e. true or false. If customer has one or more upsells on record with amount_gross > 0, then value is 1 (true), else value is 0 (false). |
| Has Upsell Perc | perc | The percentage of all customers that have an upsell. |
| Has No Upsell | boolean | A value of 1 or 0, i.e. true or false. If customer does not have an upsell on record, i.e. newsletter signup, then value is 1 (true), else value is 0 (false). |
| Upsell Gross | sum | The total lifetime gross of sales marked as upsells via metadata. |
| Upsell Num | count | The total lifetime number of sales marked as upsells via metadata |
| Upsell Perc | perc | The percentage of successful sales which were upsells compared to all successful sales. |
| Has Pending Sale | boolean | A value of 1 or 0, i.e. true or false. If customer has one or more pending sales on record then value is 1 (true), else value is 0 (false). |
| Has Pending Sale Perc | perc | The percentage of all customers that have at least one pending sale with no successful sales. |
| Has No Pending Sale | boolean | A value of 1 or 0, i.e. true or false. If customer does not have a pending sale on record then value is 1 (true), else value is 0 (false). |
| Pending Sale Amount | sum | The total lifetime amount of pending sales, regardless if declined or abandoned. |
| Pending Sale Num | count | The total lifetime number of pending sales, regardless if declined or abandoned. |
| Pending Sale Perc | perc | The percentage of pending sales compared to all sales. |
| Pending Sale Declined Amount | sum | The total lifetime amount of pending sales, which had attempted payment but were unsuccessful. |
| Pending Sale Declined Num | count | The total lifetime number of pending sales, which had attempted payment but were unsuccessful. |
| Pending Sale Abandoned Amount | sum | The total lifetime amount of pending sales, which never attempted payment. |
| Pending Sale Abandoned Num | count | The total lifetime number of pending sales, which never attempted payment. |
| Has Renewal | boolean | A value of 1 or 0, i.e. true or false. If customer has one or more subscription renewals on record, then value is 1 (true), else value is 0 (false). |
| Has No Renewal | boolean | A value of 1 or 0, i.e. true or false. If customer does not have a subscription renewal on record, then value is 1 (true), else value is 0 (false). |
| Renewal Gross | sum | The total lifetime gross of subscription renewals. |
| Renewal Num | count | The total lifetime number of subscription renewals, regardless if successful or overdue. |
| Renewal Success Num | count | The total lifetime number of successful subscription renewals. |
| Renewal Overdue Num | count | The total lifetime number of overdue subscription renewals. |
| Has Fraud Detection | boolean | A value of 1 or 0, i.e. true or false. If customer has one or more fraud detections on record, then value is 1 (true), else value is 0 (false). |
| Has Fraud Detection Perc | perc | The percentage of all customers that have a fraud detection. |
| Has No Fraud Detection | boolean | A value of 1 or 0, i.e. true or false. If customer does not have a fraud detection on record, then value is 1 (true), else value is 0 (false). |
| Fraud Detection Amount | sum | The total lifetime amount of fraud detections. |
| Fraud Detection Num | count | The total lifetime number of fraud detections. |
| Fraud Detection Perc | perc | The percentage of sales with a fraud detection. |
| Has Chargeback | boolean | A value of 1 or 0, i.e. true or false. If customer has one or more chargebacks on record, then value is 1 (true), else value is 0 (false). |
| Has Chargeback Perc | perc | The percentage of all customers that have a chargeback. |
| Has No Chargeback | boolean | A value of 1 or 0, i.e. true or false. If customer does not have a chargeback on record, then value is 1 (true), else value is 0 (false). |
| Chargeback Amount | sum | The total lifetime amount of chargebacks. |
| Chargeback Num | count | The total lifetime number of chargebacks. |
| Chargeback Perc | perc | The percentage of sales with a chargeback. |
| Has PayPal Dispute | boolean | A value of 1 or 0, i.e. true or false. If customer has one or more PayPal disputes on record, then value is 1 (true), else value is 0 (false). |
| Has No PayPal Dispute | boolean | A value of 1 or 0, i.e. true or false. If customer does not have a PayPal dispute on record, then value is 1 (true), else value is 0 (false). |
| PayPal Dispute Amount | sum | The total lifetime amount of PayPal disputes. |
| PayPal Dispute Num | count | The total lifetime number of PayPal disputes. |
| PayPal Dispute Perc | perc | The percentage of sales with a PayPal dispute. |
| Has Refund | boolean | A value of 1 or 0, i.e. true or false. If customer has one or more refunds on record, then value is 1 (true), else value is 0 (false). |
| Has Refund Perc | perc | The percentage of all customers that have a refund. |
| Has No Refund | boolean | A value of 1 or 0, i.e. true or false. If customer does not have a refund on record, then value is 1 (true), else value is 0 (false). |
| Refund Perc | perc | The percentage of sales with a refund. |
¶ Analytic Grouping
Depending on the panel element selected, you may have the option to group aggregation results using a shared property within the panel type selected. For example, you may wish to group by Product, therefore you would select “Product” as the analytic group by. Depending on the panel type and analytic selected, certain group by values are not available.
¶ Group By Properties
- Campaign
- Product
- Shop
- Payment Type: The type of payment used, i.e. Credit Card, PayPal, etc.
- Customer Group
- Coupon
- Currency: The currency associated.
- Status: The status of the item type being aggregated.
- Metadata: Metadata within the item type being aggregated.
- Revenue Source: The source of revenue, i.e. Sale, Renewal and Trial Expiration.
- Location: The customer location. I.e. Country, state, etc.
- BIN Profile: The BIN profile that was used to determine the gateway to process the Credit Card transaction.
- Subscription Profile
- Payment Profile
- Hosted Page
- Hosted Page Template
- Hosted Endpoint
- Hosted Link
- AdWords Account
- AdWords Campaign
- AdWords Ad Group
- AdWords Ad
- AdWords Keyword
- AdWords Click Type
- AdWords Device
- AdWords Network
- AdWords Slot
¶ Element
The panel element determines how the result aggregation will be displayed. Depending on the panel type, certain elements are not available. View details and examples of each element in the Panel Examples Section below.
¶ Elements
The dashboard offers various elements based on the panel type.
¶ Element Options
Depending on the panel element selected, certain element options are provided.
- Page Length: The number of rows to display per page. Table element only.
- Footer Totals: Sum/Avg all column values in a footer row. Analytic table element only.
- Date Interval: The date interval, i.e. the date range for each aggregation to be separated by. Table and Timeline elements only.
- Drilldown By: A further drilldown for an aggregation. Pie element only.
- Segment By: The segment of aggregations based on the element. Cohort and Funnel elements only.
- Line Type: Whether to display using a line or column (bar). Timeline elements only.
- Show Labels: Whether to display labels within the element. Pie element only.
- Show Legend: Whether to show a legend within the element. Pie and Timeline elements only.
¶ AdWords Options
If you have an AdWords account linked with your RevCent account, you can require that only items containing a click ID are aggregated. This ensures only items coming from an AdWords click are included in the query.
- ClickId Required: If set as true, only items containing a click ID are aggregated. Note: setting as true will exclude all non AdWords related items from being included in the aggregation.
¶ Filters
Tab and individual panel filters can be used to segment and narrow down the aggregations. For example, if you filter by campaign, only the campaigns selected will be aggregated for the individual panel or all panels in a tab. Non selected campaigns will not be included in the aggregation. Depending on the panel type selected, certain filters are not available.

¶ Account Filters
Filter using various entities specific to your RevCent account or the panel type being aggregated.
- Campaign
- Product
- Shop
- Status: The status of the item type being aggregated.
- Metadata: Metadata within the item type being aggregated.
- Revenue Source: The source of revenue, i.e. Sale, Renewal and Trial Expiration.
- Payment Type: The type of payment used, i.e. Credit Card, PayPal, etc.
- BIN Profile: The BIN profile that matched and was used in a payment profile cascade to ultimately determine the gateway to process the transaction.
- BIN In BIN Profile: Filter all transactions based on the First 6 numbers used, regardless if a BIN profile was used in the transaction. The BIN's contained in the BIN profile will be used as the filter. Useful for filtering past transactions to create a potential BIN profile.
- Customer Group
- Coupon
- PayPal Account
- Subscription Profile
- Payment Profile
- Hosted Page
- Hosted Page Template
- Hosted Endpoint
- Hosted Link
¶ AdWords Filters
Integrate your AdWords account with RevCent to filter using AdWords fields. Read more on integrating AdWords with RevCent.
- AdWords Account
- AdWords Campaign
- AdWords Ad Group
- AdWords Ad
- AdWords Keyword
¶ Date Range Filters
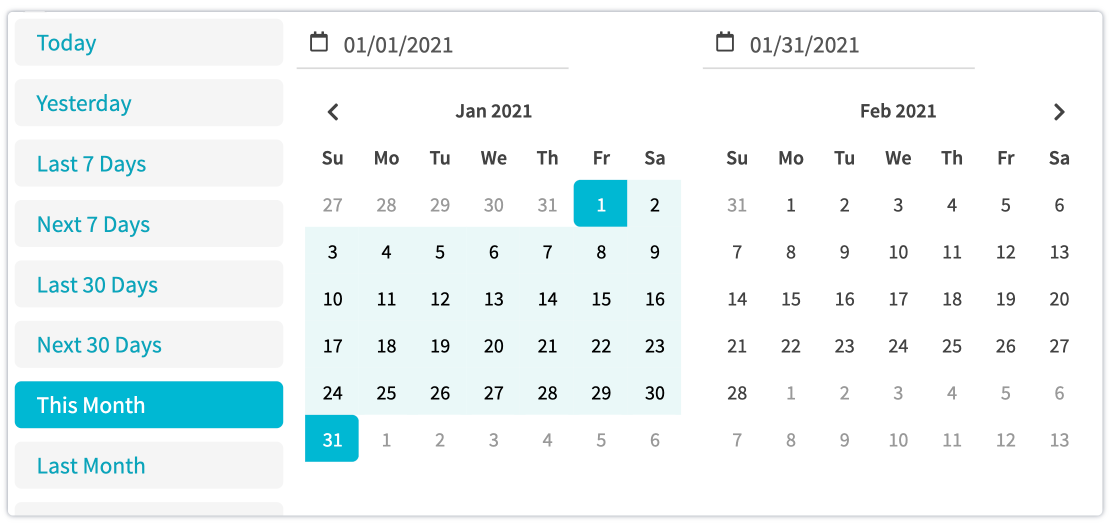
All tabs and panels have a date range filter. You can select a preset date range, or choose a custom date range.
¶ Preset Date Range
Select a preset date range using the list on the left side of the date picker shown above. Preset date ranges are dynamic, and auto update the actual viewed date range based on the current date of viewing.
¶ Custom Date Range
Select a custom date range using the two calendars in the date picker shown above. The left calendar is where you pick the start date, and the right calendar is where you pick the end date.
¶ Prebuilt Elements
A prebuilt element is an element created by RevCent to display a table or chart that may be useful to all users.
Note: Prebuilt element analytics cannot be further customized, they are fixed elements with predetermined analytic values and grouping. Filters will still apply.
¶ Prebuilt Types
Below are the prebuilt element types. Prebuilt elements are specific to individual panel types.
| Name | Panel Type | Element | Description |
|---|---|---|---|
| Payment Profile Flow Table | Transaction | Table | Table displaying the three step payment profile flow, grouped by payment profile, gateway, sum amounts and results. Steps are segmented in the table via background color |
| First 6 Gateway Stats Table | Transaction | Table | Table displaying the success and error rate percentages for the first 6 digits of credit cards used, segmented by gateway. Useful for viewing success rates of gateways based on the first 6 digits. |
| First 6 BIN Profile Stats Table | Transaction | Table | Table displaying the success and error rate percentages for the first 6 digits of credit cards used, segmented by BIN profile used for BIN routing. Useful for viewing success rates of BIN profiles. |
| First 6 BIN Profile + Gateway Stats Table | Transaction | Table | Table displaying the success and error rate percentages for the first 6 digits of credit cards used, segmented by BIN profile used for BIN routing plus the gateway which processed the transaction. Useful for comparing gateway success rates for same BIN profiles. |
¶ Panel Examples
View the panel examples below to see how you can display the aggregations you want using available elements.
¶ Metric
The metric element is the display of a single aggregate value, over a given period of time.
¶ Example Panel
In the example below, we wanted to display the gross revenue of all sales using the date filter preset of This Week.

¶ Example Panel Settings
- Type: Sale
- Element: Metric
- Element Options: N/A
- Analytic:
Aggregation: Sum
Value: Gross
- Analytic Group By: N/A
- Panel Filters:
Date Range: This Week (preset)
¶ Timeline Chart
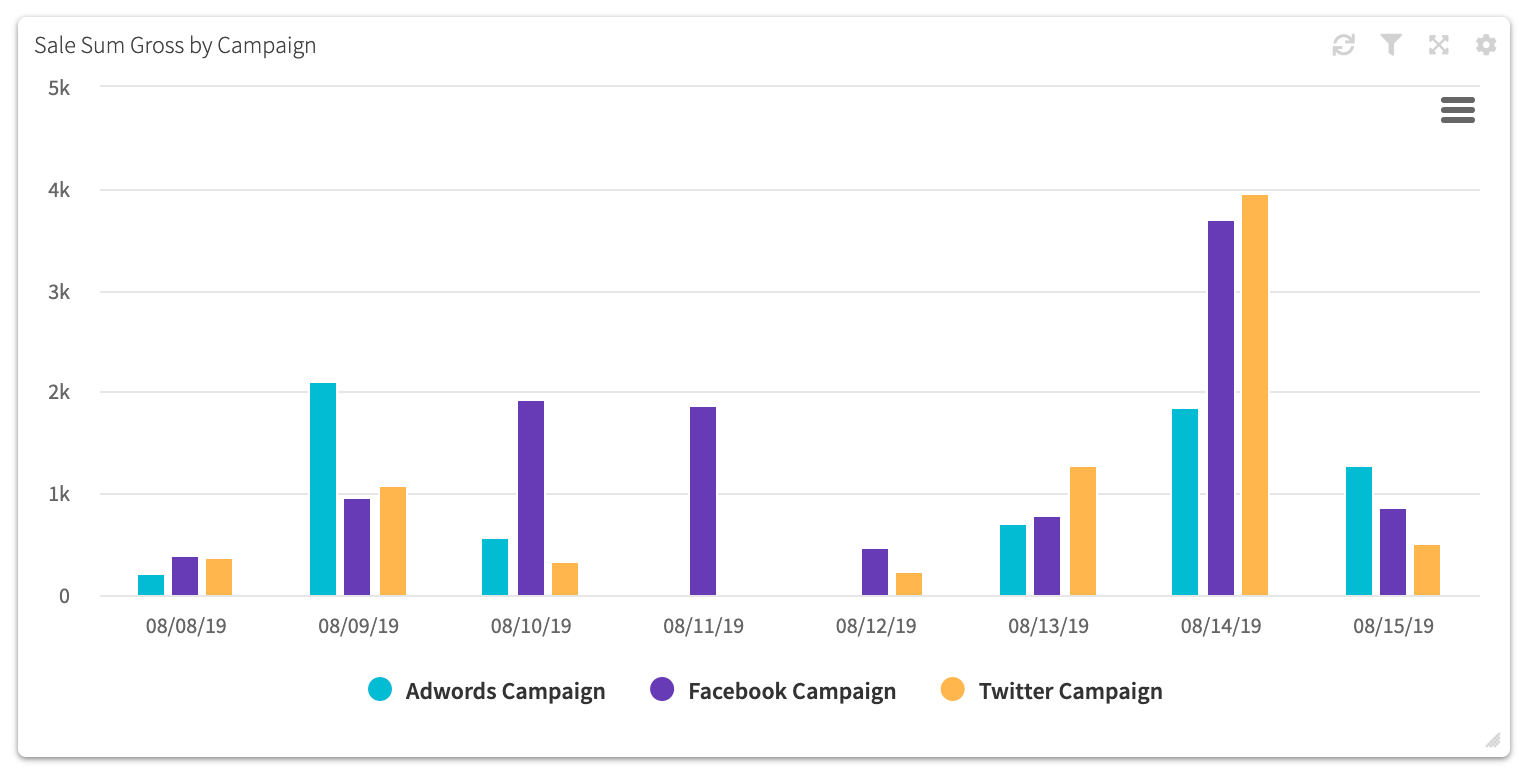
The timeline chart element is the display of a single or multiple aggregate values, grouped or ungrouped, over a given period of time, with the values displayed based on a date interval.
¶ Example Panel
In the example below, we wanted to display the gross revenue of all sales, for each day, grouped by RevCent campaign, within the date range 8/8/19 to 8/15/19.
¶ Example Panel Settings
- Type: Sale
- Element: Timeline
- Element Options:
Date Interval: Day
Line Type: Column
- Analytic:
Aggregation: Sum
Value: Gross
- Analytic Group By: Campaign
- Panel Filters:
Date Range: 8/8/19 - 8/15/19 (custom)
¶ Pie Chart
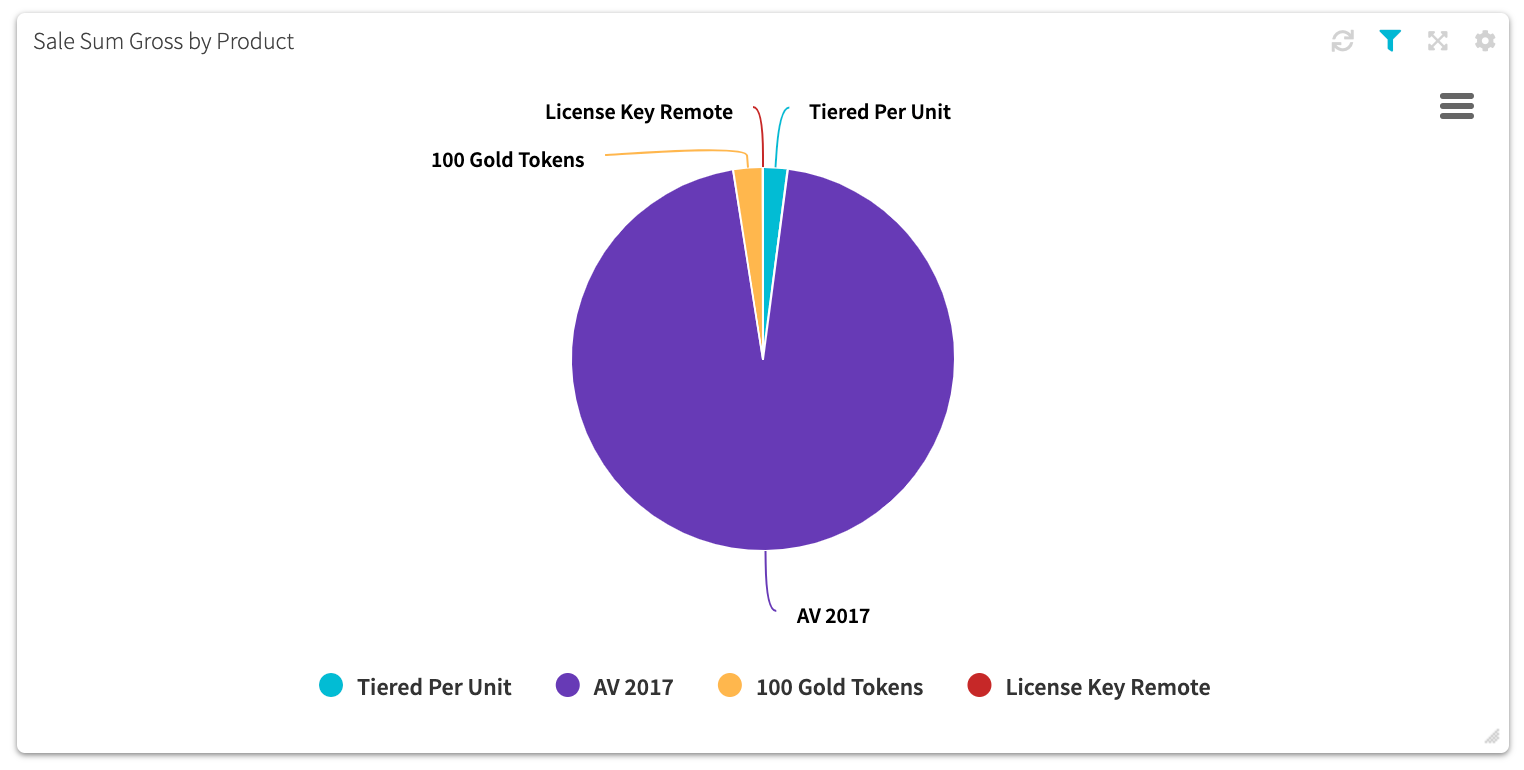
The pie chart element is the display of a single aggregate value, grouped by a common attribute, over a given period of time.
¶ Example Panel
In the example below, we wanted to display the gross revenue of all sales, grouped by product, for the current month.
¶ Example Panel Settings
- Type: Sale
- Element: Pie
- Element Options:
Legend: True
Labels: True
- Analytic:
Aggregation: Sum
Value: Gross
- Analytic Group By: Product
- Panel Filters:
Date Range: This Month (preset)
¶ Map
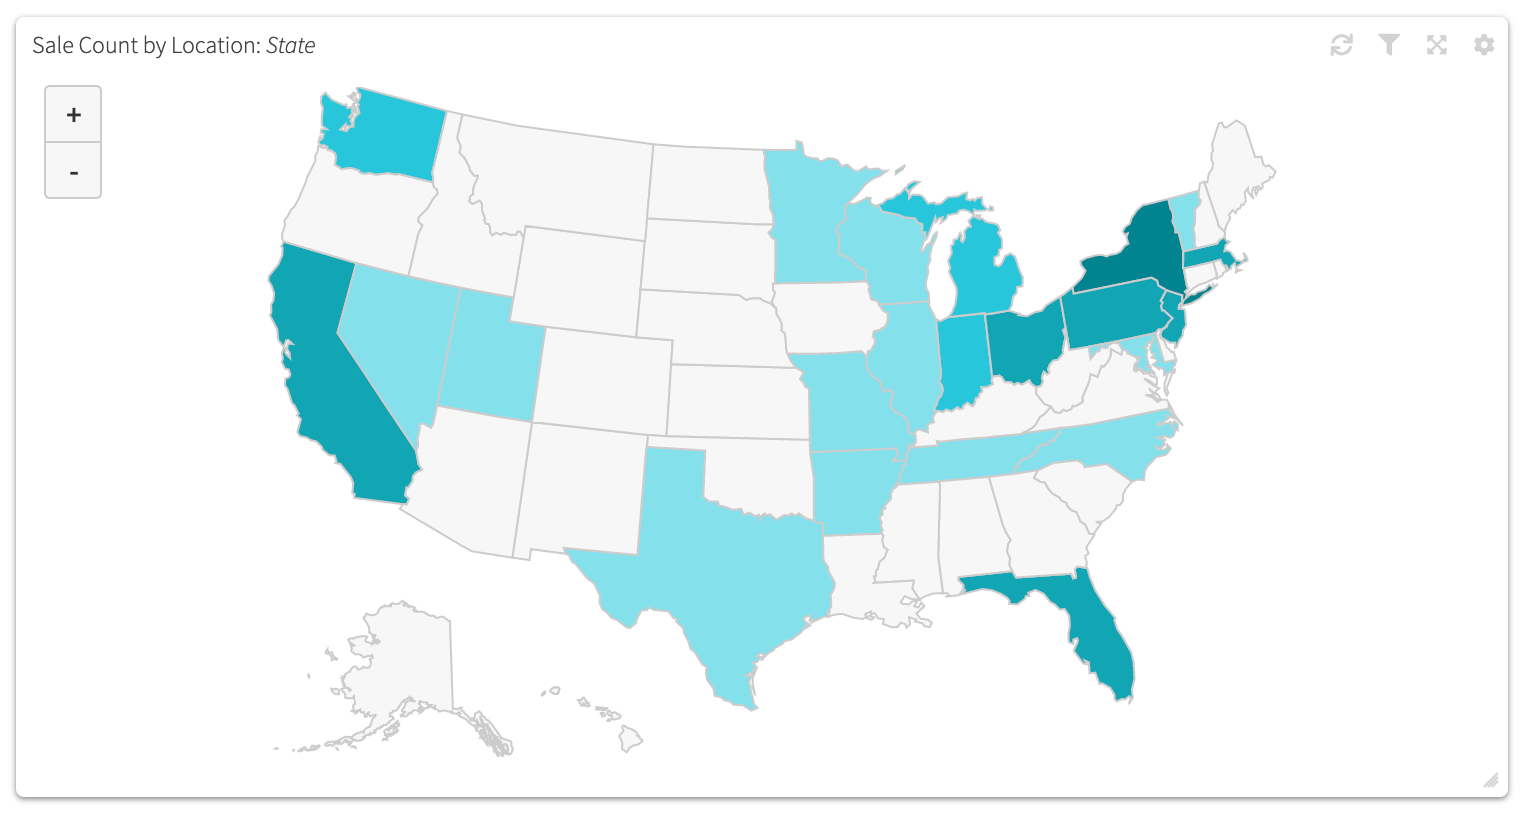
The map element is the display of a single aggregate value grouped by a location, over a given period of time. Available grouping locations are county (USA), state (USA) and country.
¶ Example Panel
In the example below, we wanted to display the number of sales per state for the current year.
¶ Example Panel Settings
- Type: Sale
- Element: Map
- Element Options: N/A
- Analytic:
Aggregation: Count
Value: Sale
- Analytic Group By: State
- Panel Filters:
Date Range: This Year (preset)
¶ Cohort Chart
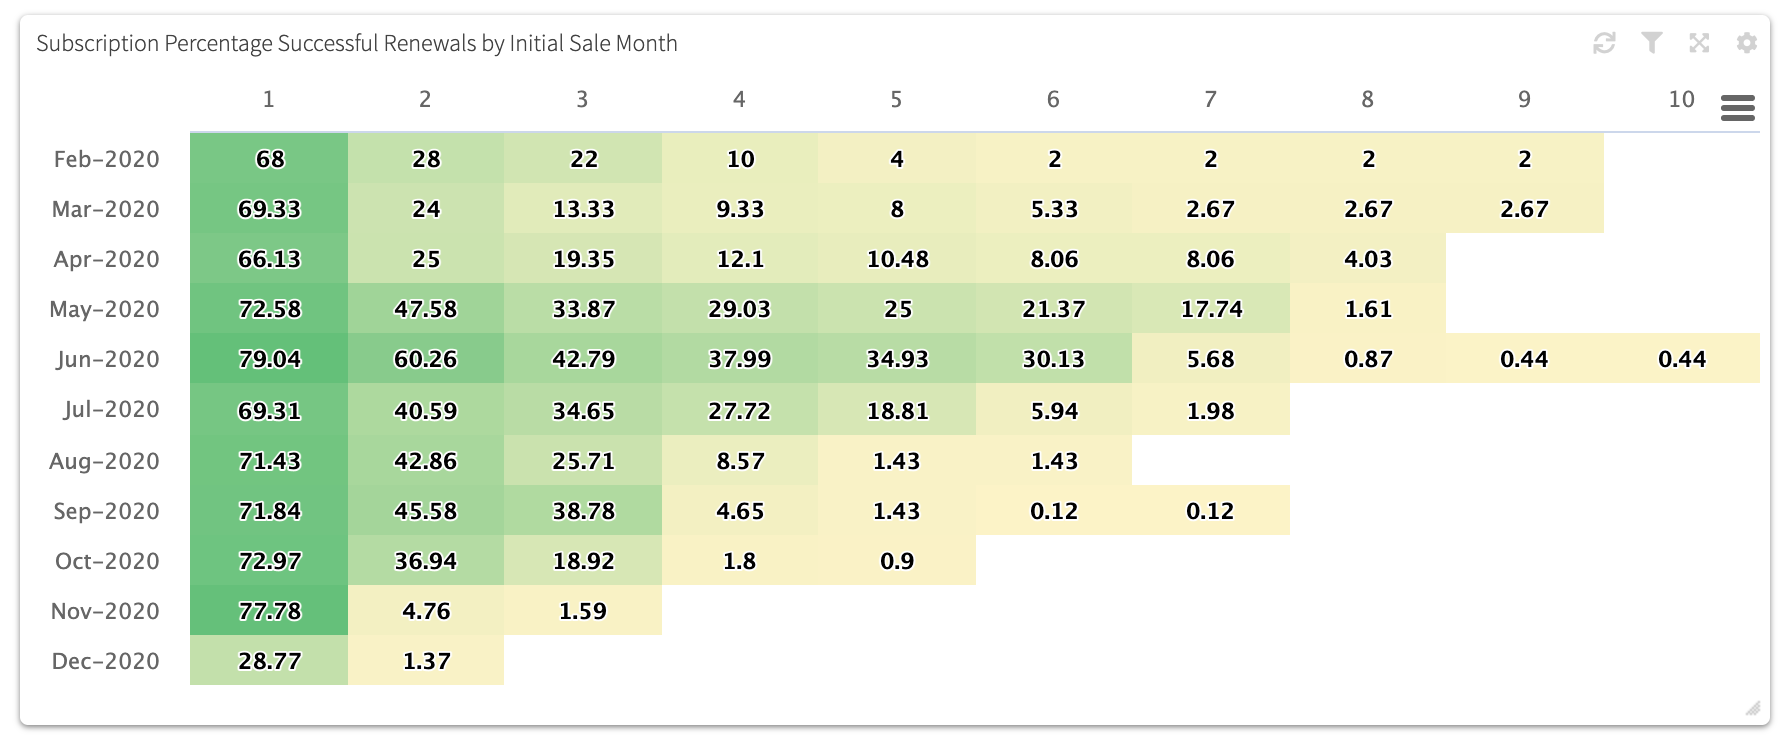
The cohort chart element is the display of an aggregate value for items that share a common attribute, segmented, over a given period of time.
¶ Example Panel
In the example below, we wanted to display the percentage of successful renewals, segmented by renewal cycle, grouped by the month the subscriptions were initially created, for the current year to date.
¶ Example Panel Settings
- Type: Subscription
- Element: Cohort
- Element Options:
Segment By: Renewal Cycle
- Analytic:
Aggregation: Percentage
Value: Successful Renewals
- Analytic Group By: Initial Sale Month
- Panel Filters:
Date Range: YTD (preset)
¶ Funnel Chart
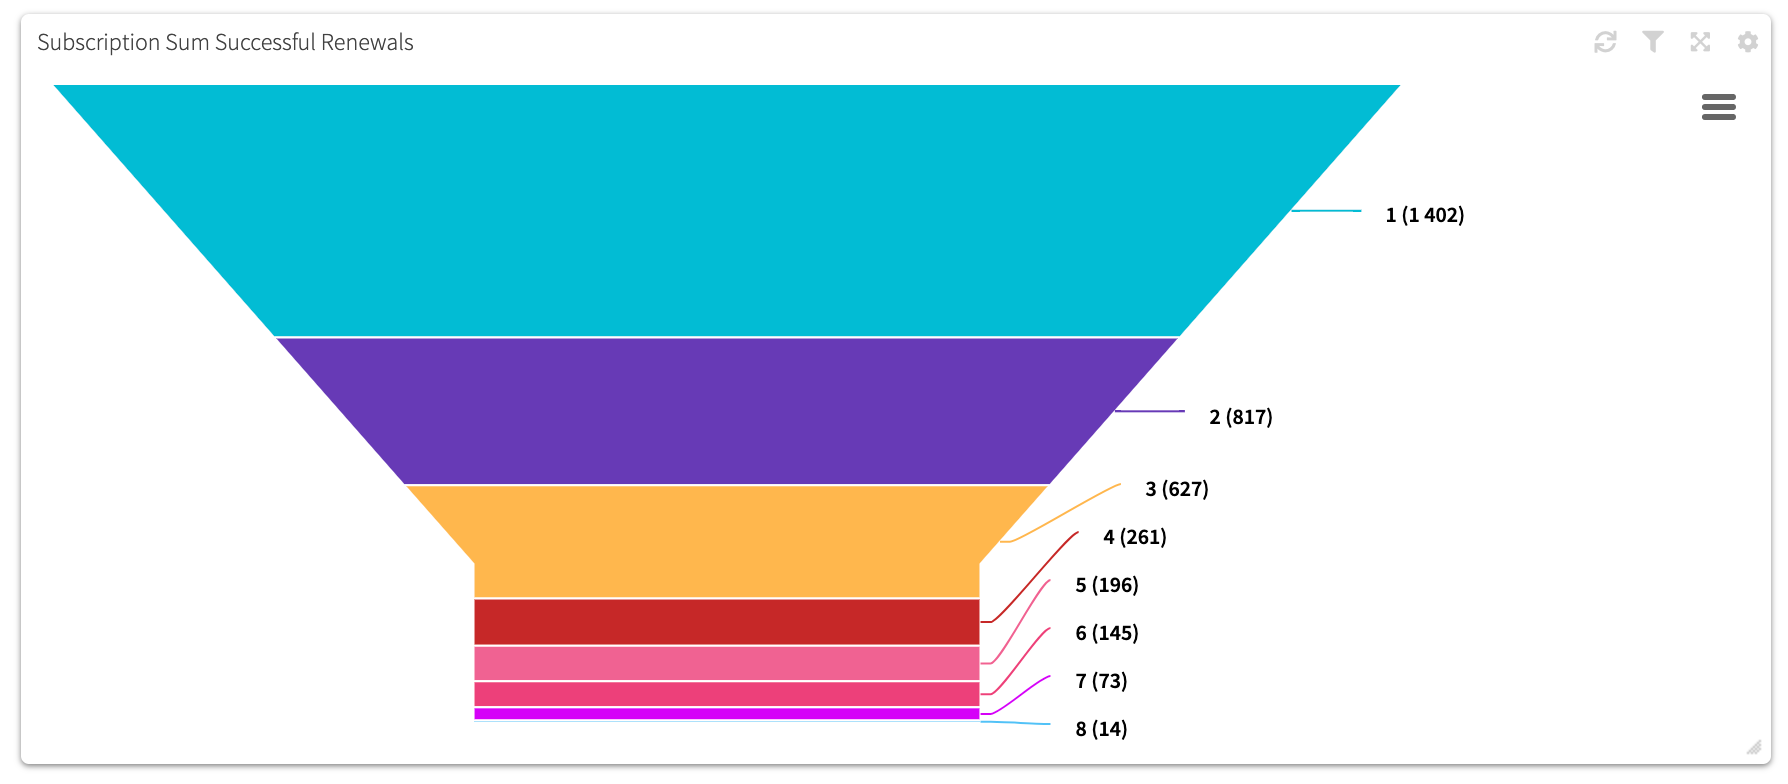
The funnel chart element is the display of an aggregate value for items that share a common attribute, segmented, over a given period of time.
¶ Example Panel
In the example below, we wanted to display the number of successful renewals for each renewal cycle for the current year to date.
¶ Example Panel Settings
- Type: Subscription
- Element: Funnel
- Element Options:
Segment By: Renewal Cycle
- Analytic:
Aggregation: Sum
Value: Successful Renewals
- Analytic Group By: N/A
- Panel Filters:
Date Range: YTD (preset)
¶ Table (Analytic)
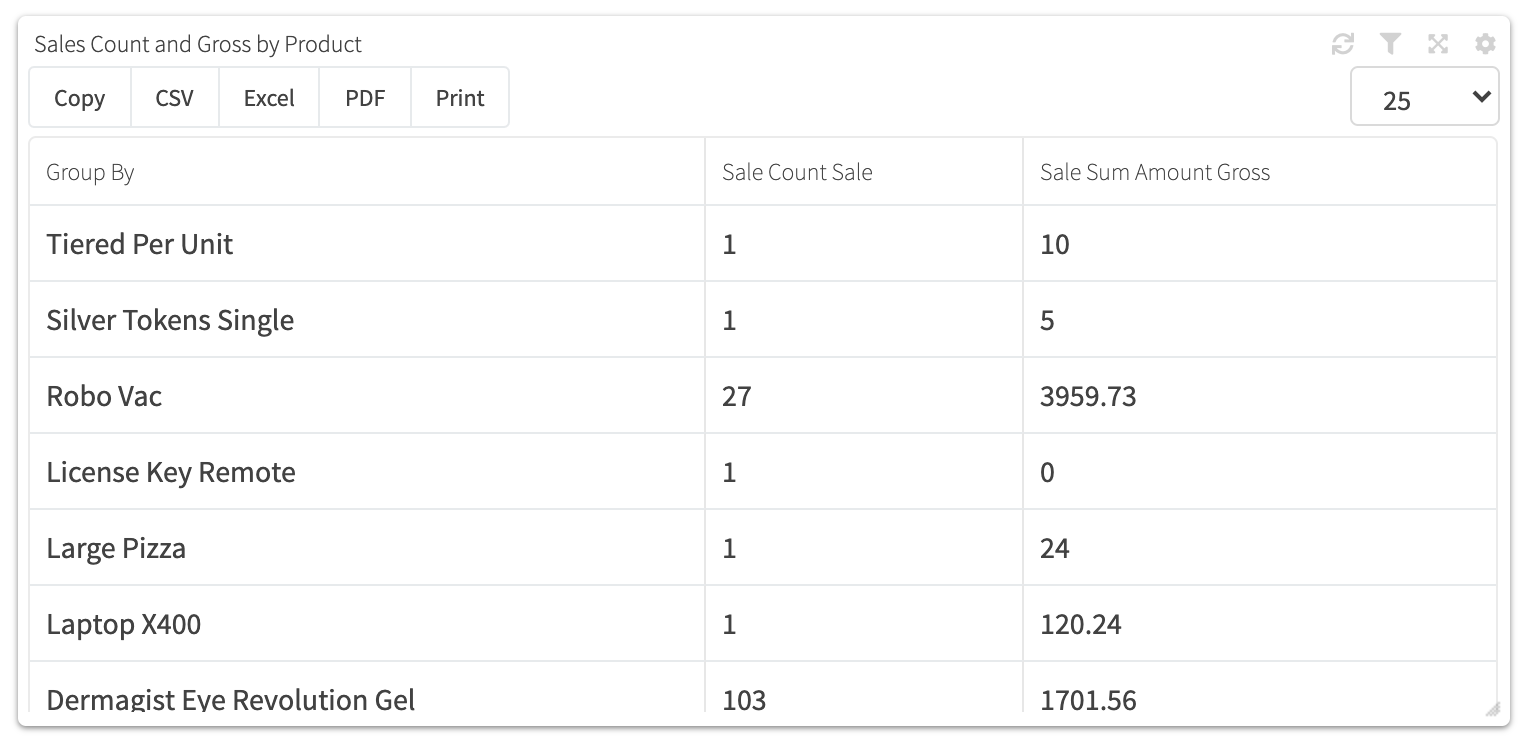
The analytic table element is the display of a single or multiple aggregate values, grouped by a common attribute, over a given period of time.
¶ Example Panel
In the example below, we wanted to display the number of sales and the gross revenue of sales, grouped by product, for the current month.
¶ Example Panel Settings
- Type: Sale
- Element: Table
Type: Metric
- Element Options:
Page Length: 25
- Analytic:
Aggregation 1: Count
Value 1: Sale
Aggregation 2: Sum
Value 2: Gross
- Analytic Group By: Product
- Panel Filters:
Date Range: This Month (preset)
¶ Table (List)
The list element is the same display as a table for a list page depending on the panel type. It is a convenient way to view the same table with preset filters.
¶ Example Panel
In the example below, we wanted to display the list table for shipping items for the current month.

¶ Example Panel Settings
- Type: Shipping
- Element: Table
Type: List
- Element Options:
Page Length: 5
- Analytic: N/A
- Analytic Group By: N/A
- Panel Filters:
Date Range: This Month (preset)