¶ Overview
To help explain the cascade step process within a payment profile, including advanced gateway settings, we have created several examples. Each example is unique to the step settings, advanced gateway settings as well as revenue rules and time rules. The table and diagram for each example are related and show both a tabular and visual representation of the same cascade step.
If you have any questions, please do not hesitate to contact us.
¶ Cascade Step Process
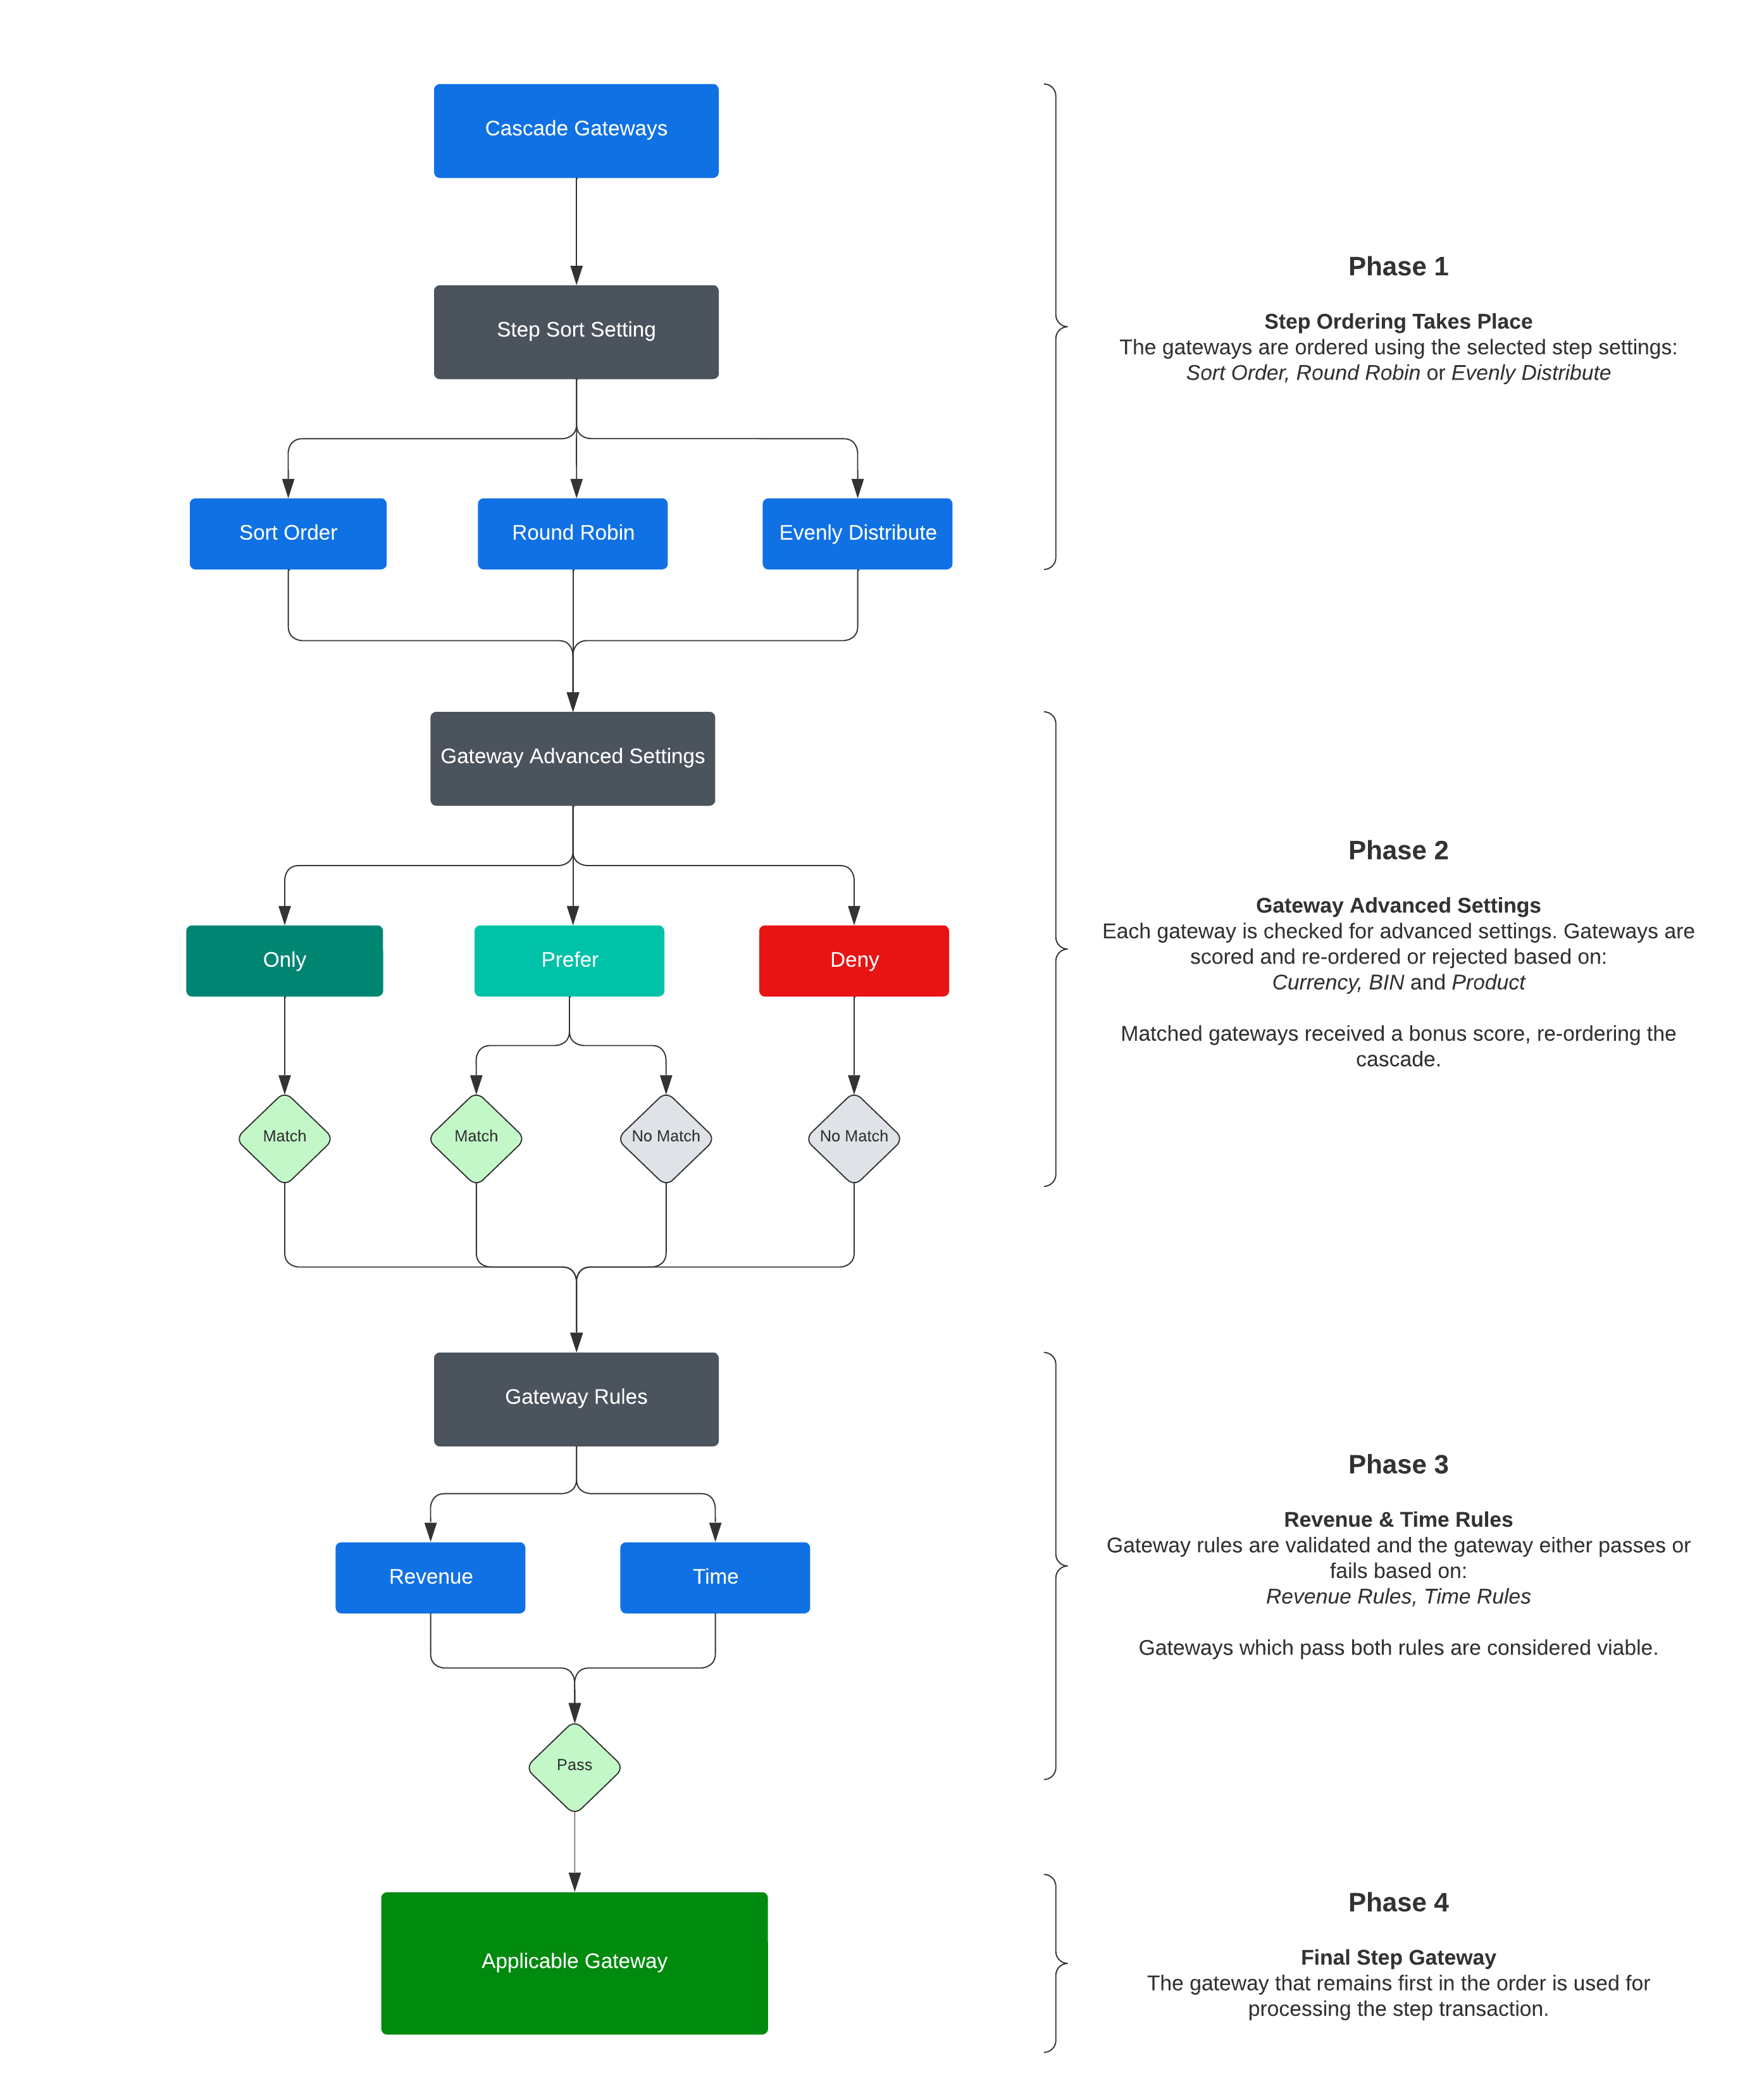
The example below shows the process of gateway ordering and selection when a payment profile cascade is used.

¶ Phase 1: Step Sorting
Read more in depth about Cascade Gateway Order and step sorting options: Sort Order, Round Robin and Evenly Distribute.
¶ Phase 2: Advanced Scoring
Each gateways' Advanced Settings have a different score associated for Only and Prefer. This gives you the ability to configure advanced settings in a way that allows maximum flexibility based on currency, BIN and product combined.
Note: Any Deny matches immediately remove the gateway from the cascade for the specific transaction, regardless of Only or Prefer matches..
¶ Scoring Table
| Only Match | Only No Match | Prefer Match | Prefer No Match | Deny Match | Deny No Match | |
|---|---|---|---|---|---|---|
| Currency | +25 | gateway rejected | +1 | +0 | gateway rejected | +0 |
| BIN 8/6 | +15/+14 | gateway rejected | +4/+3 | +0 | gateway rejected | +0 |
| Product Group | +8 | gateway rejected | +1 | +0 | gateway rejected | +0 |
¶ Phase 3: Revenue & Time Rules
Read more in depth about Revenue Rules and Time Rules.
¶ Phase 4: Final Order
The first gateway in the final order after phases 1, 2 and 3 are complete is used to process the transaction.
¶ Example 1 (Currency)
Example 1 shows a scenario of currency routing. Currency takes precedence over BIN and Product Group when using the Only type option. This allows you to target specific gateway(s) at the currency level
The cascade step process is in four phases:
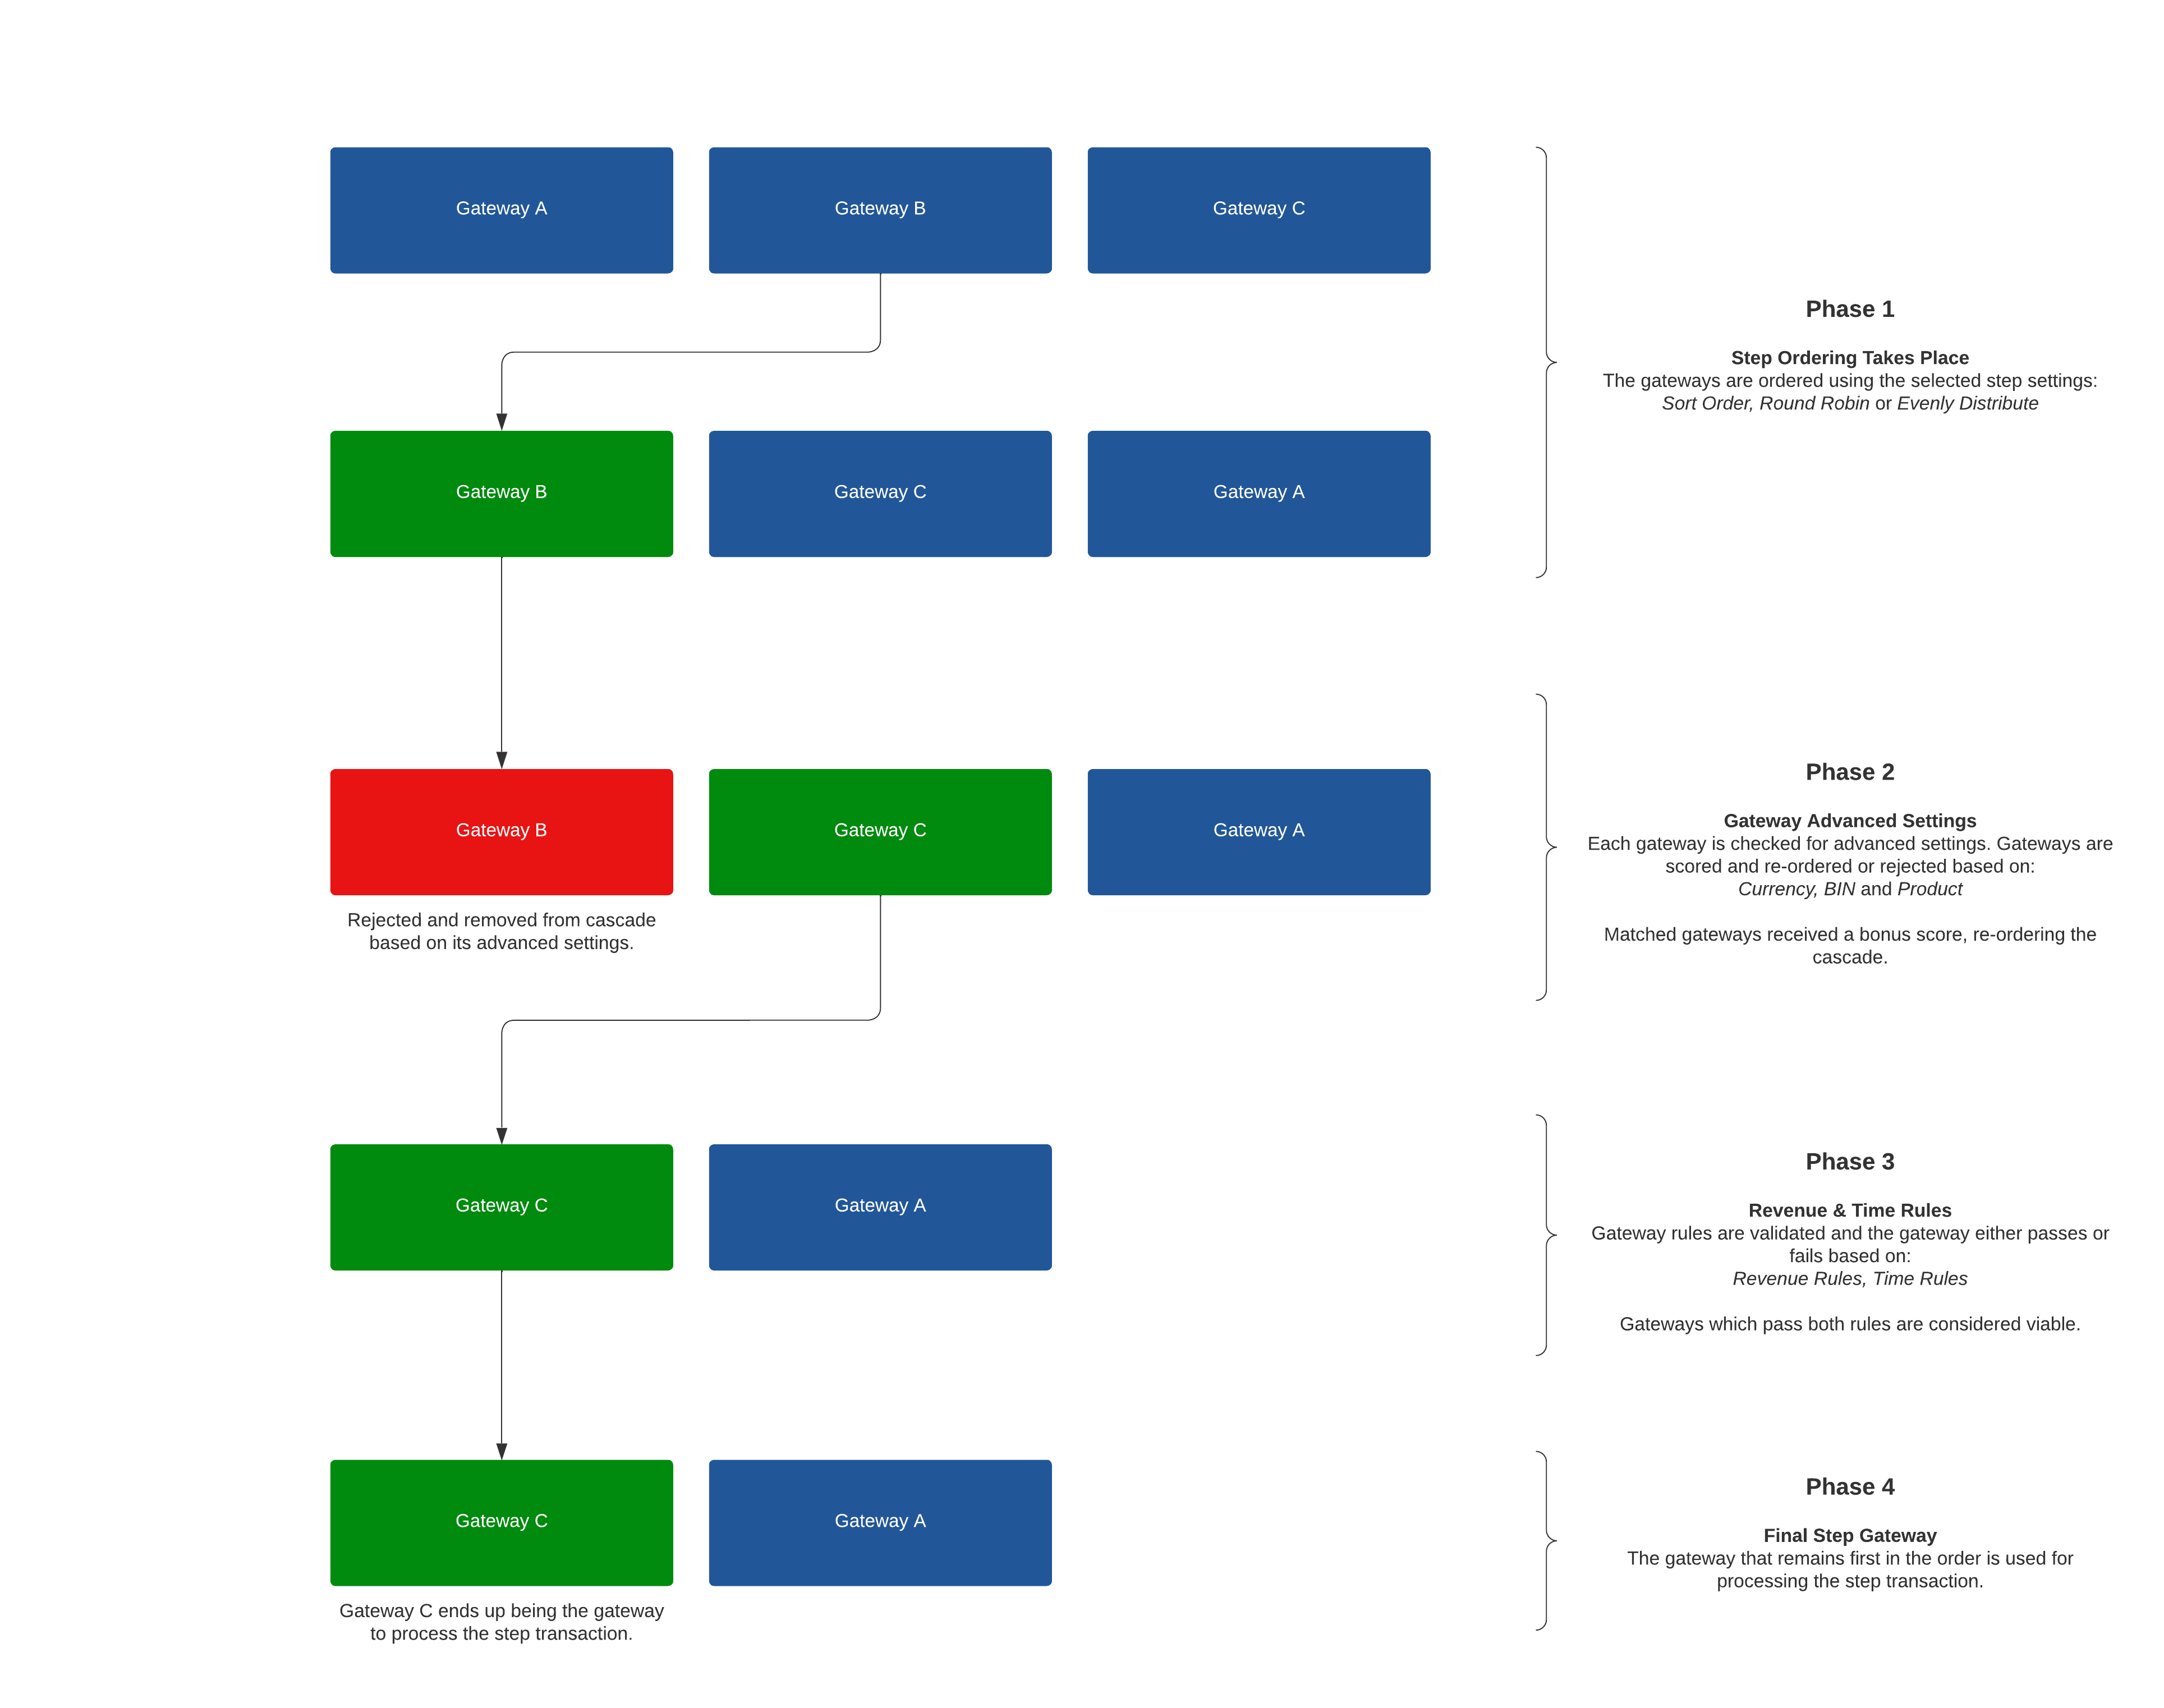
- The default order in the cascade is re-ordered according to the step sort setting: Sort Order, Round Robin or Evenly Distribute. In the example below, Gateway B is set to first in the order due to a Round Robin sort setting (Gateway A processed the most recent transaction).
- Each gateway within the cascade is checked for Advanced Settings: Currency, BIN and Product Group. The cascade is then re-ordered according to the advanced settings. In this example, Gateway C receives a +25 score for an Only Currency match. Notice that gateway B was removed from the cascade based on its advanced settings.
- Each remaining gateway is then checked for Revenue Rules and Time Rules, potentially rejecting one or more gateways. Both gateways A & C passed their revenue rules.
- The first gateway in the final order after phases 1, 2 and 3 are complete is used to process the transaction. Gateway C is first in the order and will process the transaction.
¶ Example 1 Table
The table below shows a detailed overview of each gateway and phase within the cascade step for example 1.
| Gateway A | Gateway B | Gateway C | Description | ||
|---|---|---|---|---|---|
| Phase 1 | Step Sorting | ||||
| Default Order | 1 | 2 | 3 | ||
| New Order | 3 | 1 | 2 | Step sort setting: Round Robin. Gateway A was last used, Gateway B is now first in the order. | |
| Phase 2 | Advanced Sorting | ||||
| Currency Only | +0 | +0 | +25 | Gateway C is given +25 due to a match for only currency. | |
| Currency Prefer | +1 | +0 | +0 | Gateway A is given +1 due to a match for prefer currency. | |
| Currency Deny | +0 | Match | +0 | Gateway B is rejected due to a match for deny currency. | |
| BIN Only | +0 | - | +0 | ||
| BIN Prefer | +0 | - | +0 | ||
| BIN Deny | +0 | - | +0 | ||
| Product Only | +0 | - | +0 | ||
| Product Prefer | +0 | - | +0 | ||
| Product Deny | +0 | - | +0 | ||
| Advanced Score | 4 | 25 | The advanced score is determined for each non-rejected gateway. | ||
| New Order | 2 | 1 | Gateway C has a higher advanced score than A. Gateway C is now first in the order. | ||
| Phase 3 | Gateway Rules | ||||
| Revenue Rules | Passed | - | Passed | ||
| Time Rules | Passed | - | Passed | ||
| Final Order | 2 | Rejected | 1 | Gateway C is first in the order, mainly due to the Only Currency score. |
¶ Example 1 Diagram
The diagram below is a visual representation of the cascade step, using the example table data above.

¶ Example 2 (BIN)
Example 2 shows a scenario of BIN routing. In this BIN example, the customer is using a credit card with a BIN of 42424248. Both Gateway A and Gateway C have BIN Profile(s) attached. However, Gateway A has a BIN 8 match of 42424248 and Gateway C has a BIN 6 match of 424242. A higher score is given to a BIN 8 match vs a BIN 6 match, allowing fine tuned gateway target at the BIN length level.
Phases:
The cascade step process is in four phases:
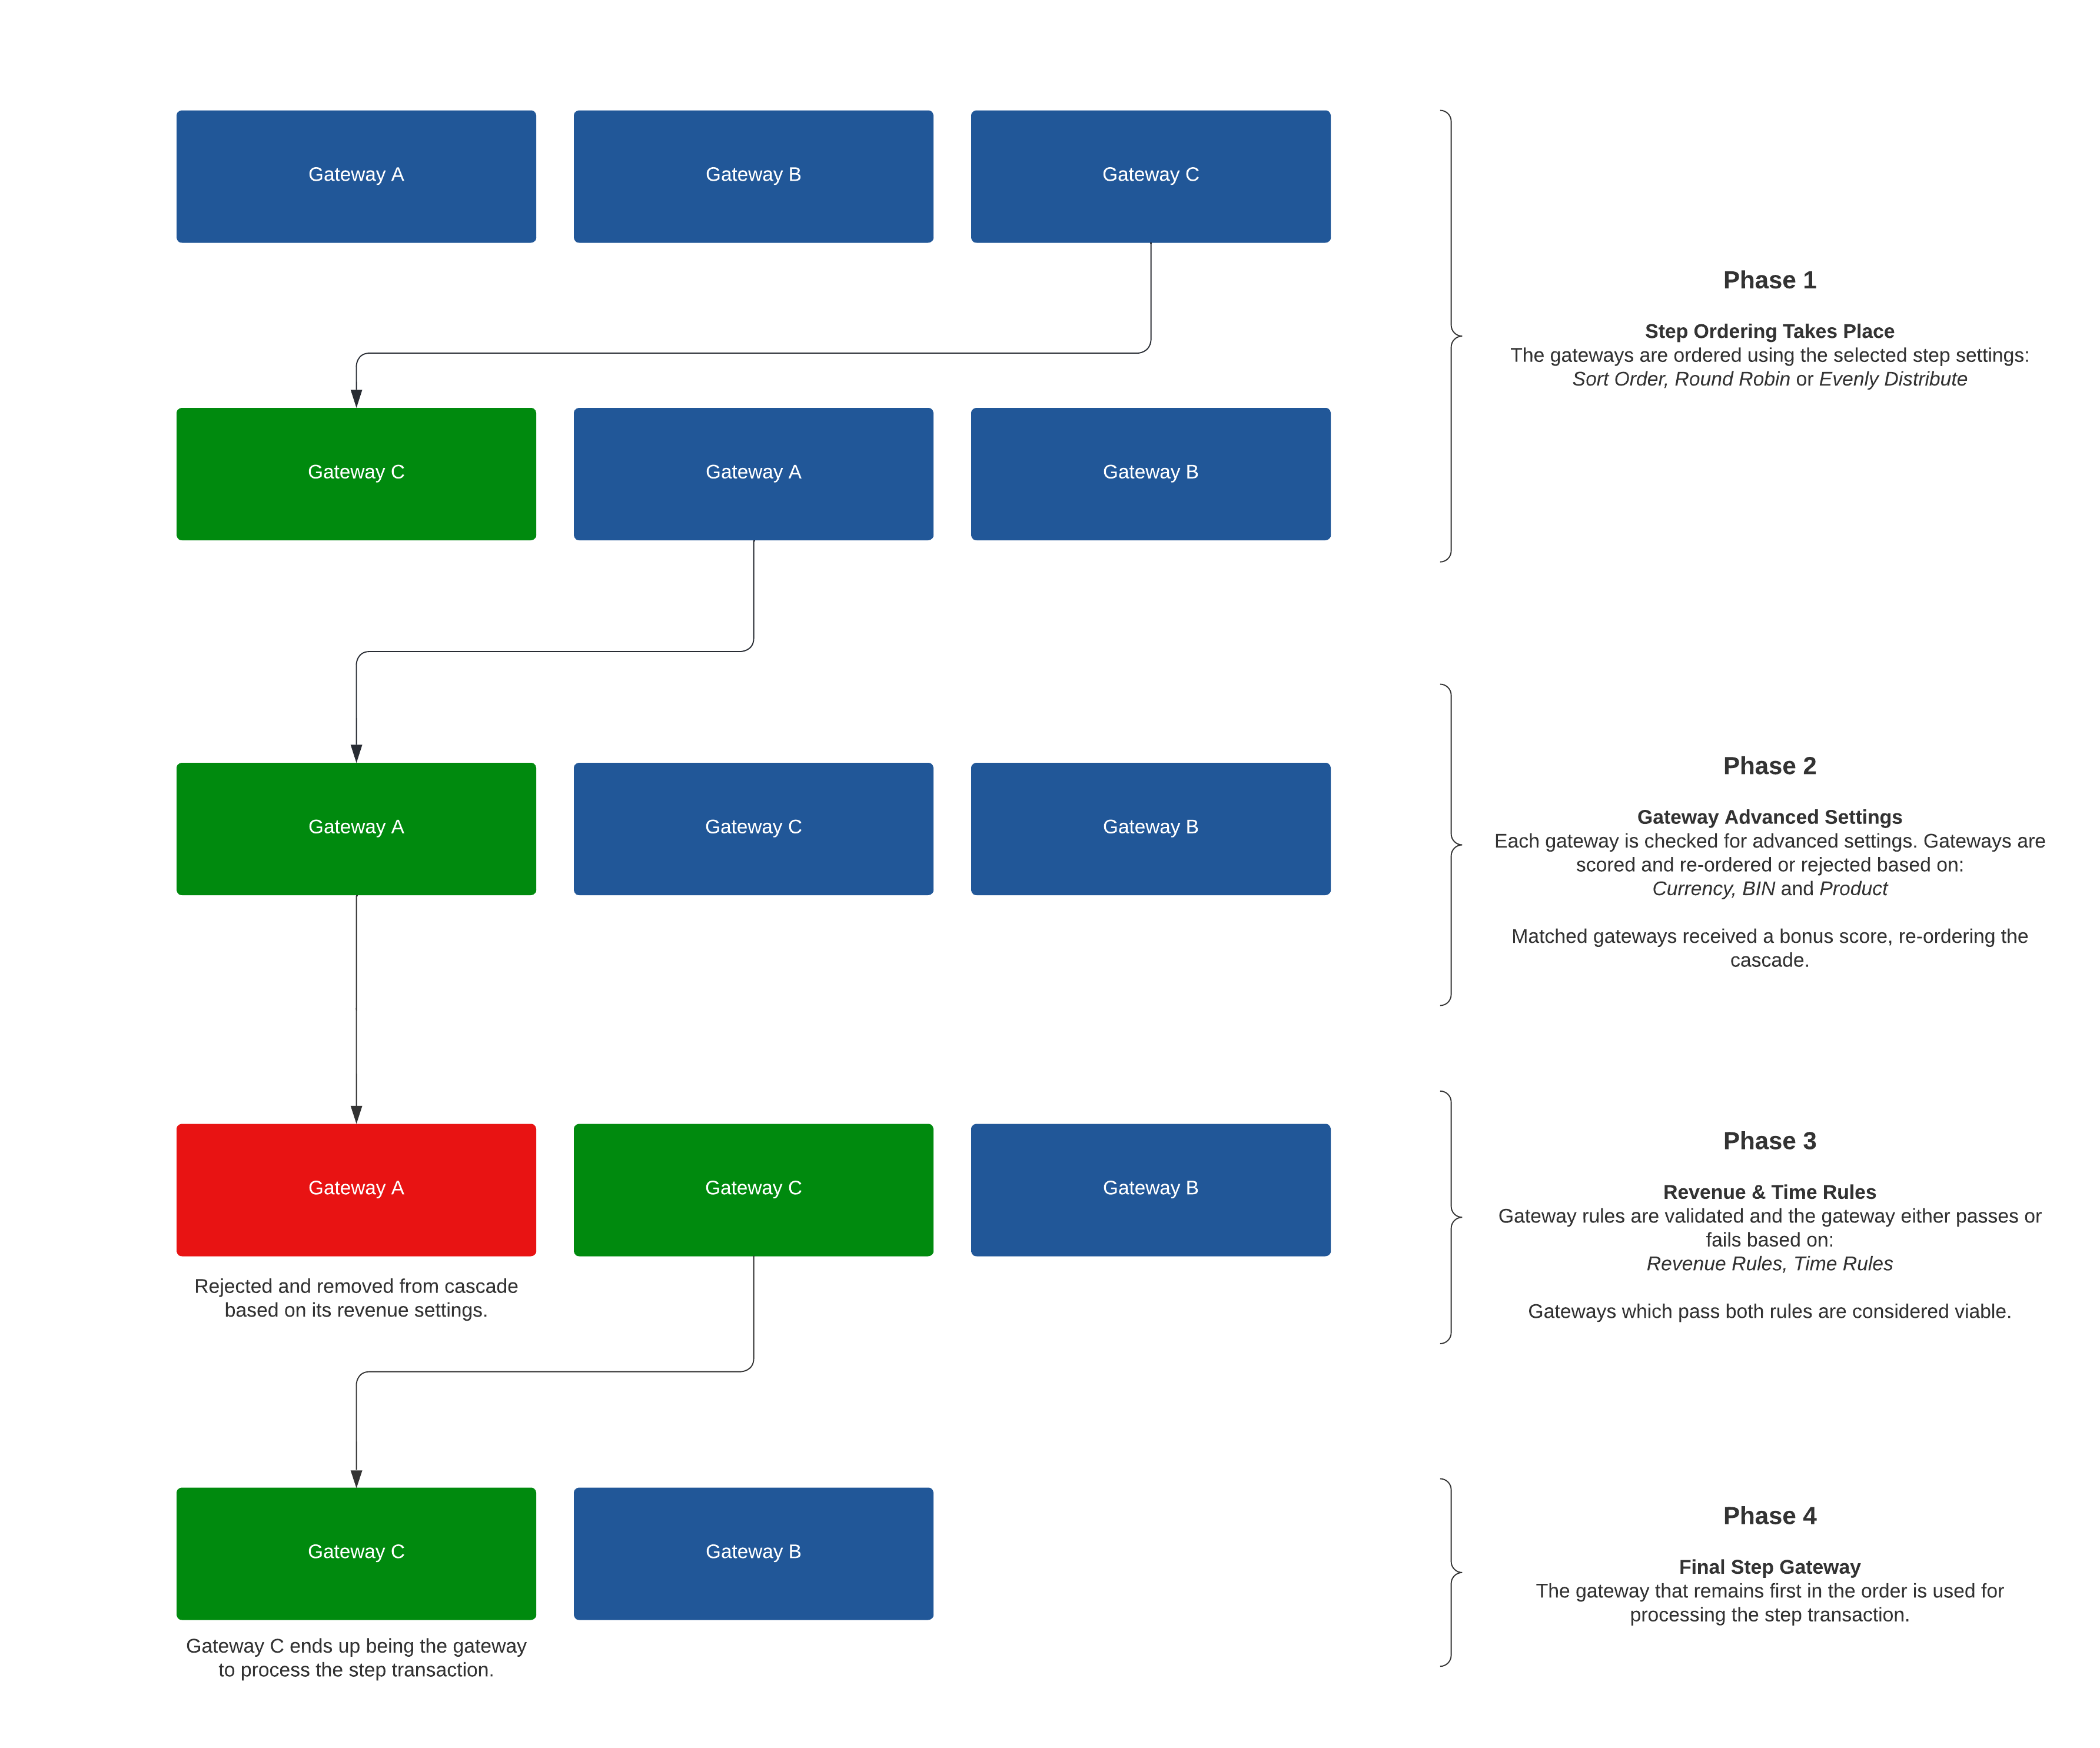
- The default order in the cascade is re-ordered according to the step sort setting: Sort Order, Round Robin or Evenly Distribute. In the example below, Gateway C is set to first in the order due to the Evenly Distribute sort setting. Gateway C has the lowest transaction volume in the past 24 hours, followed by A and B. Gateway C is now first in the cascade order
- Each gateway within the cascade is checked for Advanced Settings: Currency, BIN and Product Group. The cascade is then re-ordered according to the advanced settings. Gateway A receives a +4 score for a Prefer BIN 8 match and Gateway C receives a +3 score for a Prefer BIN 6 match. Gateway A received the highest score and is now first in the cascade order.
- Each remaining gateway is then checked for Revenue Rules and Time Rules, potentially rejecting one or more gateways. Both Gateway B and Gateway C passed their revenue rules. However, Gateway A is rejected due to a failed revenue rule. Gateway C is now first in the order due to Gateway A's rejection.
- The first gateway in the final order after phases 1, 2 and 3 are complete is used to process the transaction. Gateway C is first in the order and will process the transaction.
¶ Example 2 Table
The table below shows a detailed overview of each gateway and phase within the cascade step for example 2.
| Gateway A | Gateway B | Gateway C | Description | ||
|---|---|---|---|---|---|
| Phase 1 | Step Sorting | ||||
| Default Order | 1 | 2 | 3 | ||
| New Order | 2 | 3 | 1 | Step sort setting: Evenly Distribute. Gateway C had the lowest transaction volume, followed by Gateway A and Gateway B. | |
| Phase 2 | Advanced Sorting | ||||
| Currency Only | +0 | +0 | +0 | ||
| Currency Prefer | +0 | +0 | +0 | ||
| Currency Deny | +0 | +0 | +0 | ||
| BIN Only | +0 | +0 | +0 | ||
| BIN Prefer | +4 | +0 | +3 | Gateway A is given +4 due to a match for prefer BIN 8, and Gateway C is given +3 for prefer BIN 6. | |
| BIN Deny | +0 | +0 | +0 | ||
| Product Only | +0 | +0 | +0 | ||
| Product Prefer | +0 | +0 | +0 | ||
| Product Deny | +0 | +0 | +0 | ||
| Advanced Score | 4 | 0 | 3 | The advanced score is determined for each non-rejected gateway. | |
| New Order | 1 | 3 | 2 | Gateway A has a higher advanced score than C follow by B. Gateway A is now first in the order. | |
| Phase 3 | Gateway Rules | ||||
| Revenue Rules | Failed | Passed | Passed | Gateway A is rejected due to a failed a revenue rule. | |
| Time Rules | - | Passed | Passed | ||
| Final Order | Rejected | 2 | 1 | Gateway C is first in the order and will process the transaction. |
¶ Example 2 Diagram
The diagram below is a visual representation of the cascade step, using the example table data above.

¶ Example 3 (Non Advanced)
Example 3 shows a scenario where none of the gateways have advanced settings. This skips Phase 2, as advanced ordering requires at least one gateway with advanced settings.
Phases:
The cascade step process is in four phases:
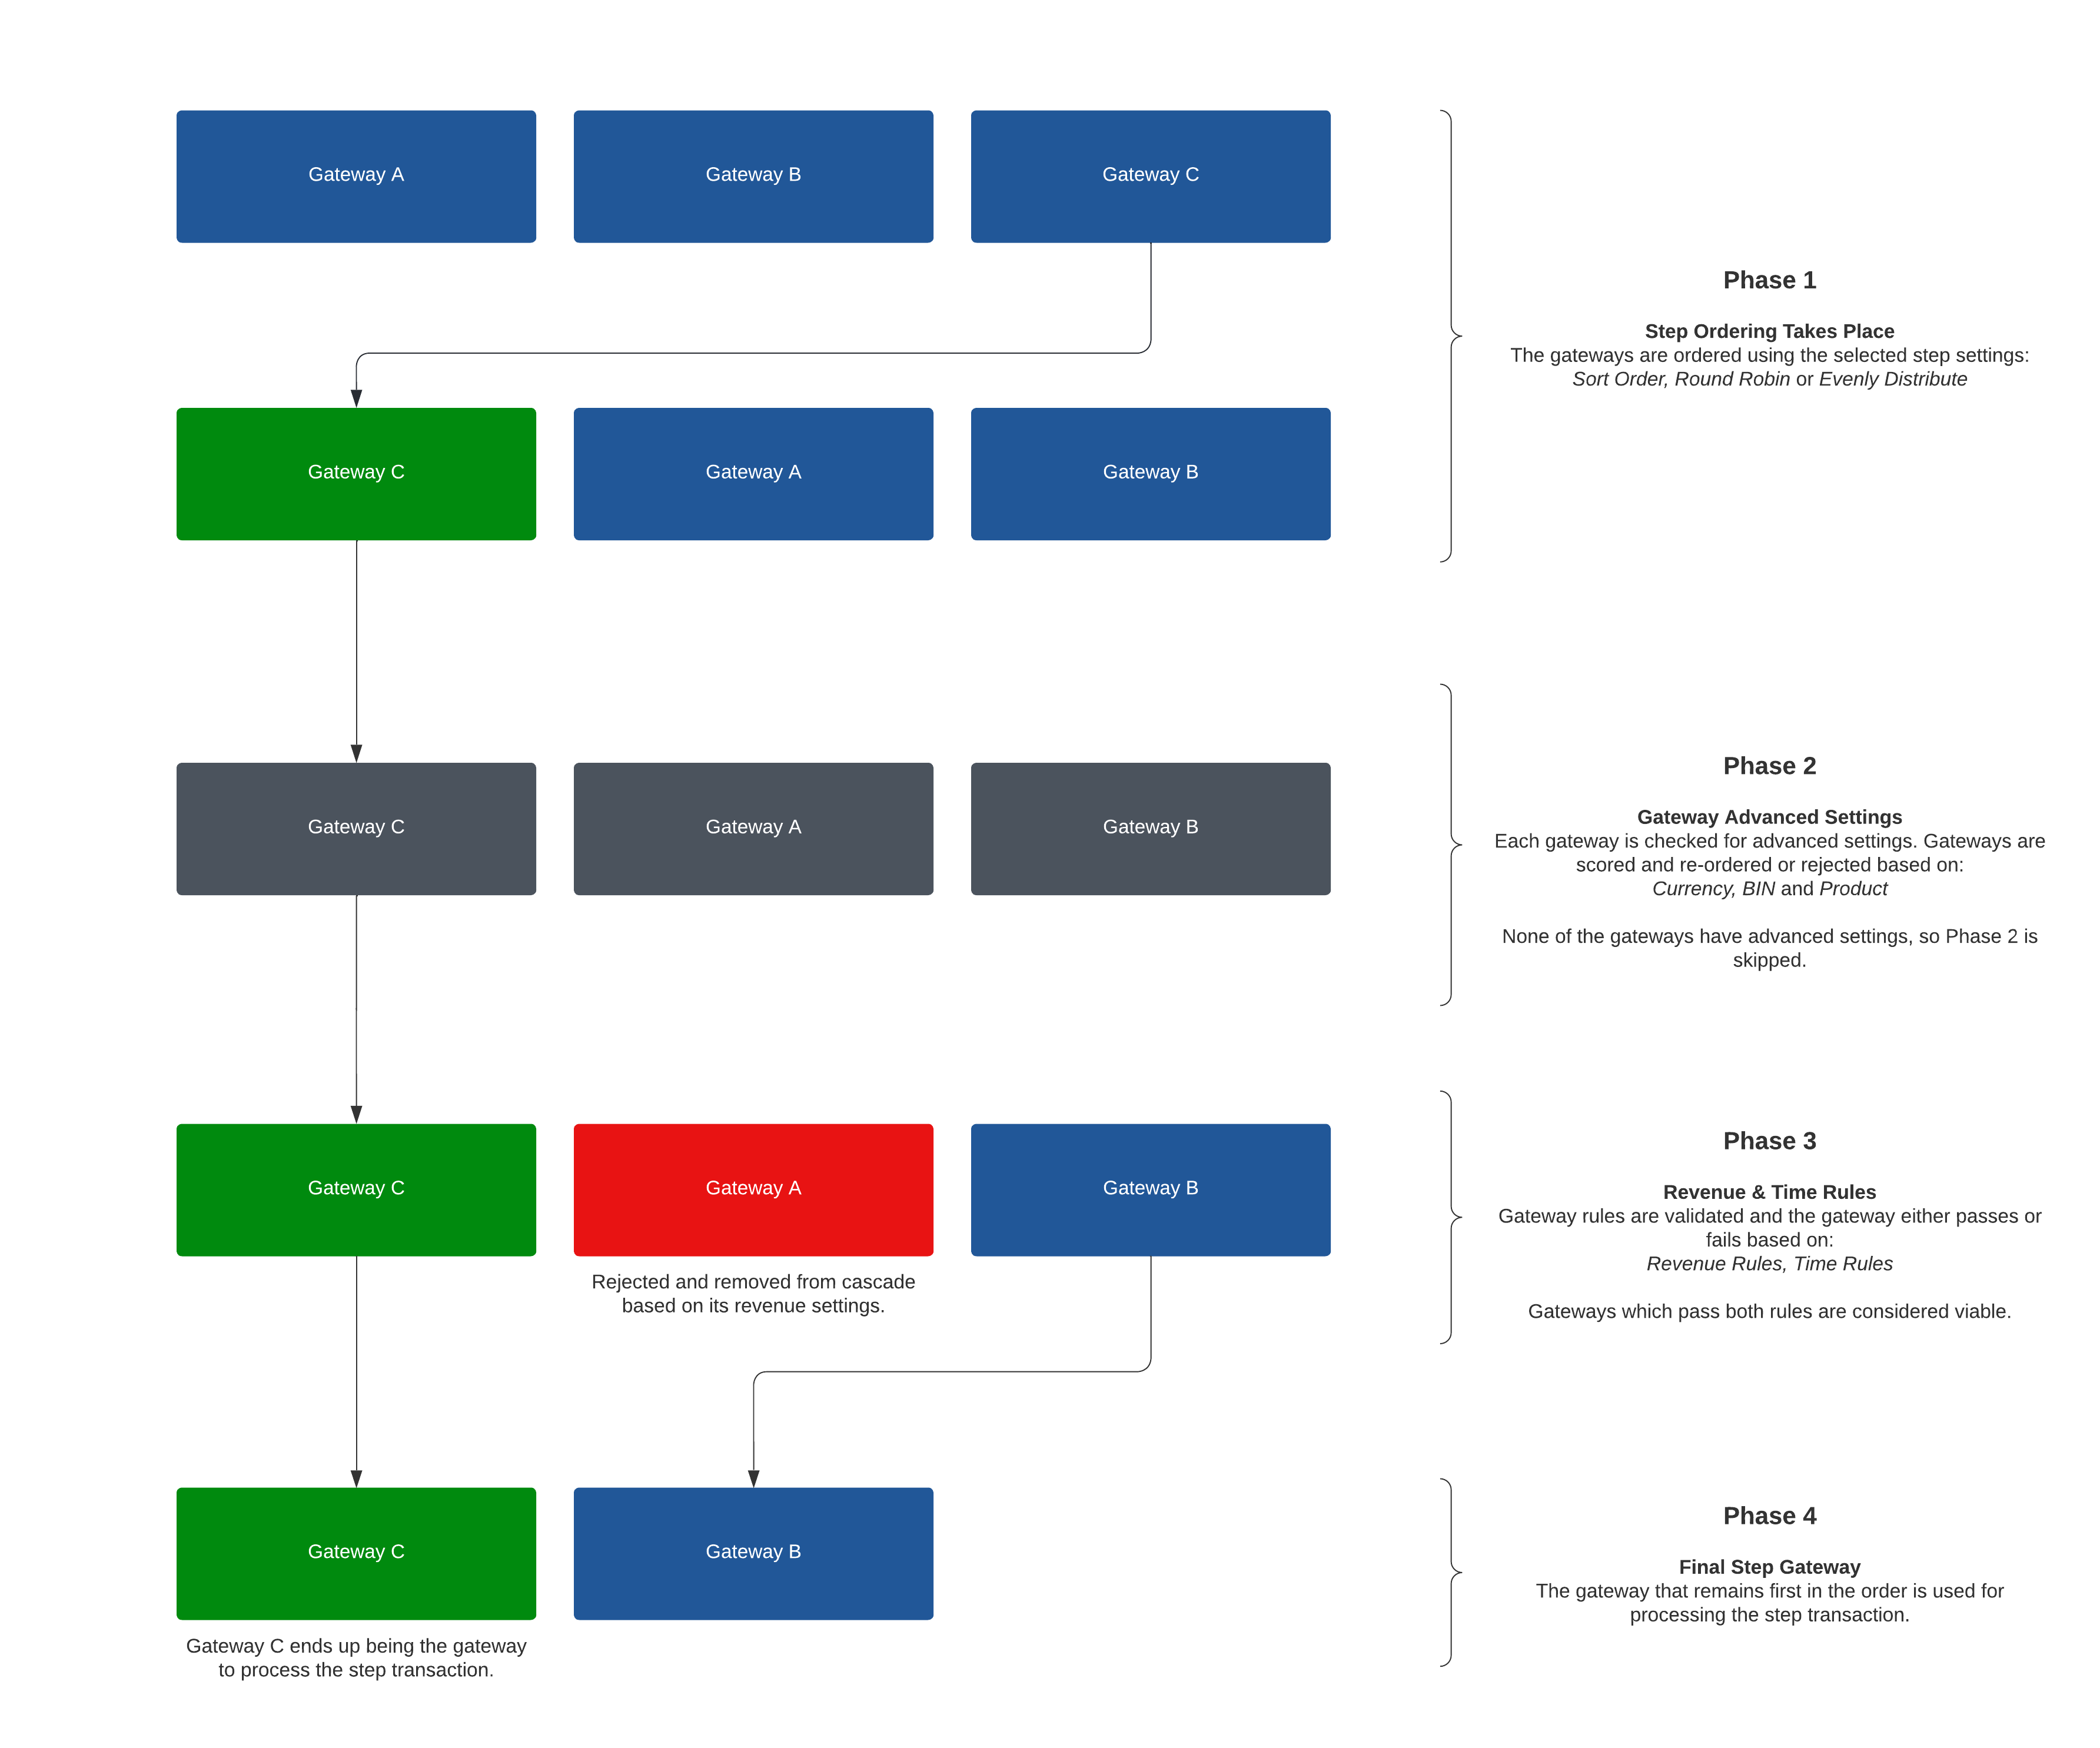
- The default order in the cascade is re-ordered according to the step sort setting: Sort Order, Round Robin or Evenly Distribute. In the example below, Gateway C is set to first in the order due to a Round Robin sort setting (Gateway B processed the most recent transaction).
- Each gateway within the cascade is checked for Advanced Settings: Currency, BIN and Product Group. In this example none of the gateways have advanced settings, therefore phase 2 is skipped..
- Each remaining gateway is then checked for Revenue Rules and Time Rules, potentially rejecting one or more gateways. Gateway A is rejected due to a failed revenue rule. However, this does not matter as Gateway C was already first in the order.
- The first gateway in the final order after phases 1, 2 and 3 are complete is used to process the transaction. Gateway C is first in the order and will process the transaction.
¶ Example 3 Table
The table below shows a detailed overview of each gateway and phase within the cascade step for example 3.
| Gateway A | Gateway B | Gateway C | Description | ||
|---|---|---|---|---|---|
| Phase 1 | Step Sorting | ||||
| Default Order | 1 | 2 | 3 | ||
| New Order | 2 | 3 | 1 | Step sort setting: Round Robin. Gateway B was last used, Gateway C is now first in the order. | |
| Phase 2 | Advanced Sorting | ||||
| Advanced Score | +0 | 0 | +0 | None of the gateways had advanced settings, therefore the advanced sorting is skipped. | |
| New Order | 2 | 3 | 1 | Gateway C remains first in the cascade order. | |
| Phase 3 | Gateway Rules | ||||
| Revenue Rules | Failed | Passed | Passed | Gateway A is rejected due to a failed a revenue rule. | |
| Time Rules | - | Passed | Passed | ||
| Final Order | Rejected | 2 | 1 | Gateway C is first in the order and will process the transaction. |
¶ Example 3 Diagram
The diagram below is a visual representation of the cascade step, using the example table data above.
